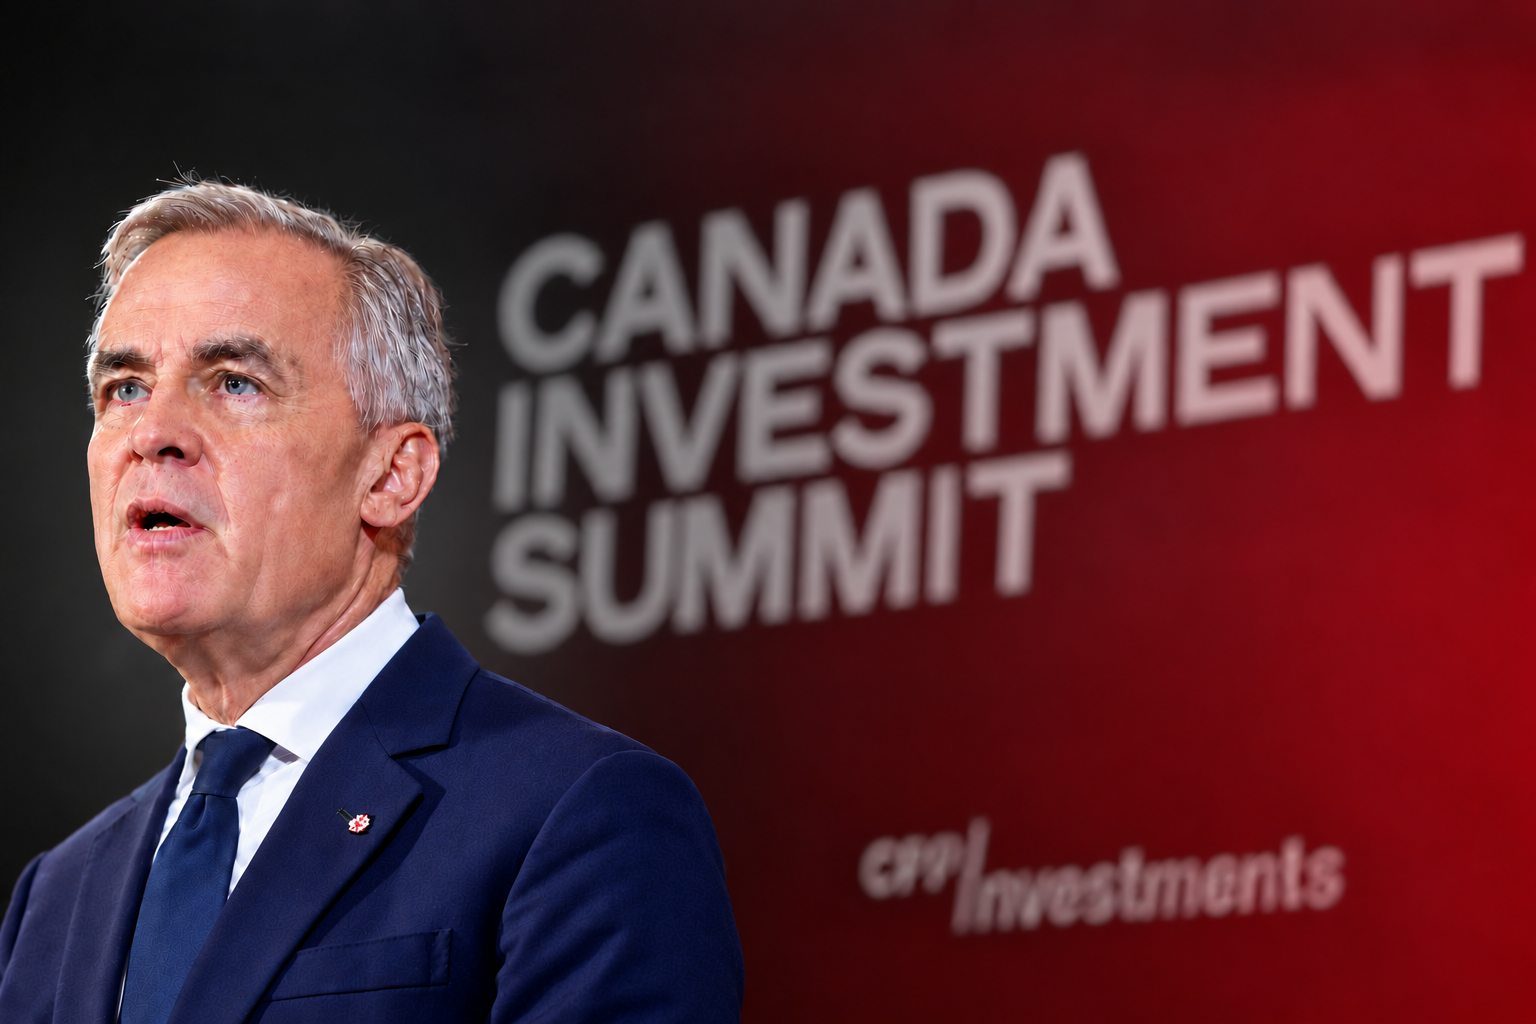
The world’s next great investment destination has been hiding in plain sight — and nearly half a trillion dollars just proved it. In one week in September, Canada’s banks, pension funds, and one telecom company pledged nearly $500 billion in new capital — the largest concentrated capital mobilization event in the country’s history. What happens next determines whether that was a turning point, or a headline.
A Prediction
By 2035, Canada holds a $2 trillion sovereign wealth fund — one of the two largest on earth. By 2040, it holds $3 trillion — the largest sovereign wealth fund in the world. This is not a forecast. It is a projection, grounded in Norway’s precedent, Canada’s broader resource base, and a contribution rate the math supports. The rest of this essay builds the argument — and tests it against what just happened in Toronto, and against a decade of evidence about why Canada has struggled to convert opportunity into capacity before.
The North Star
Canadians call it the True North.
The phrase comes from the national anthem — “The True North strong and free.” For most of the past fifty years, it was a sentiment more than a strategy. A country vast in resource, high in education, stable in governance — and quiet. Methodical. Understated in a way that is almost uniquely Canadian.
That is changing. And when it does, the numbers will be unlike anything the world has seen from a single country in a generation.
Here is the prediction: Canada builds a national sovereign wealth fund. By 2035, it reaches $2 trillion — placing Canada among the two largest sovereign funds on earth. By 2040, it reaches $3 trillion — making it the largest sovereign wealth fund in the world. The projection behind that number is not speculative. It is grounded in Norway’s proven trajectory, Canada’s broader resource base than Norway has ever had, confirmed global demand channels, and a $150 billion annual contribution rate the math supports. This essay builds that case from the ground up.
In the past twelve months, Canada secured $97 billion in foreign direct investment. It signed critical minerals agreements with Panasonic, Apple, Siemens, and Rio Tinto. It embedded itself into European security infrastructure as the only non-European nation in the SAFE program. Then, on September 14 and 15, Toronto hosted the first-ever Canada Investment Summit, gathering the world’s largest institutional investors and banks — reported variously as roughly 100 to 250 attendees, collectively overseeing capital in the tens of trillions of dollars — built around a $1 trillion investment target.
By the time it ended, Canadian banks, pension funds, and one telecom company had pledged nearly $500 billion in new capital across energy, critical minerals, AI infrastructure, and defence. That is not a preview anymore. It is a data point — the largest one this essay has to work with, and the one every other claim in it must now survive contact with.
Every serious investor, strategist, and policymaker should be paying close attention to Canada right now.
Not because the number is new. Because it was always coming — and because the number that matters now is not what was pledged, but what gets built.
The Capital Base
Half a century of quiet building is about to be unleashed.
The story of Canada’s economic strength begins not in 2026, but in 1945.
When World War II ended, most of the world’s major economies lay in ruin. Europe was rebuilding from rubble. Canada emerged largely intact — and largely overlooked. What it did with that moment was build.
While Europe reconstructed, Canada laid:
- Highways, hydroelectric infrastructure, and auto manufacturing corridors
- Universal healthcare and public education systems that would develop human capital for generations
- A fiscal discipline that compounded quietly for decades
When the 2008 global financial crisis struck, the divergence became impossible to ignore. Banks collapsed across the developed world. Deficits exploded. Canada’s banking system held — not one major bank failed or required a government bailout, and the World Economic Forum ranked it the soundest in the world for six consecutive years. Its deficit recovered faster than any G7 peer. Growth resumed while others were still in emergency fiscal mode.
This was not luck. It was the product of half a century of deliberate, quiet building.
The numbers confirm it:
- Lowest net debt-to-GDP in the G7 for twenty consecutive years — 10.2% in 2025
- Lowest marginal effective tax rate on new business investment in the G7 — 6.4%, down from roughly 13% after 2026’s Productivity Mega Deduction, which lifted immediate-expensing coverage from about 15% to more than 65% of eligible assets
- #2 on the Kearney FDI Confidence Index, behind the United States only
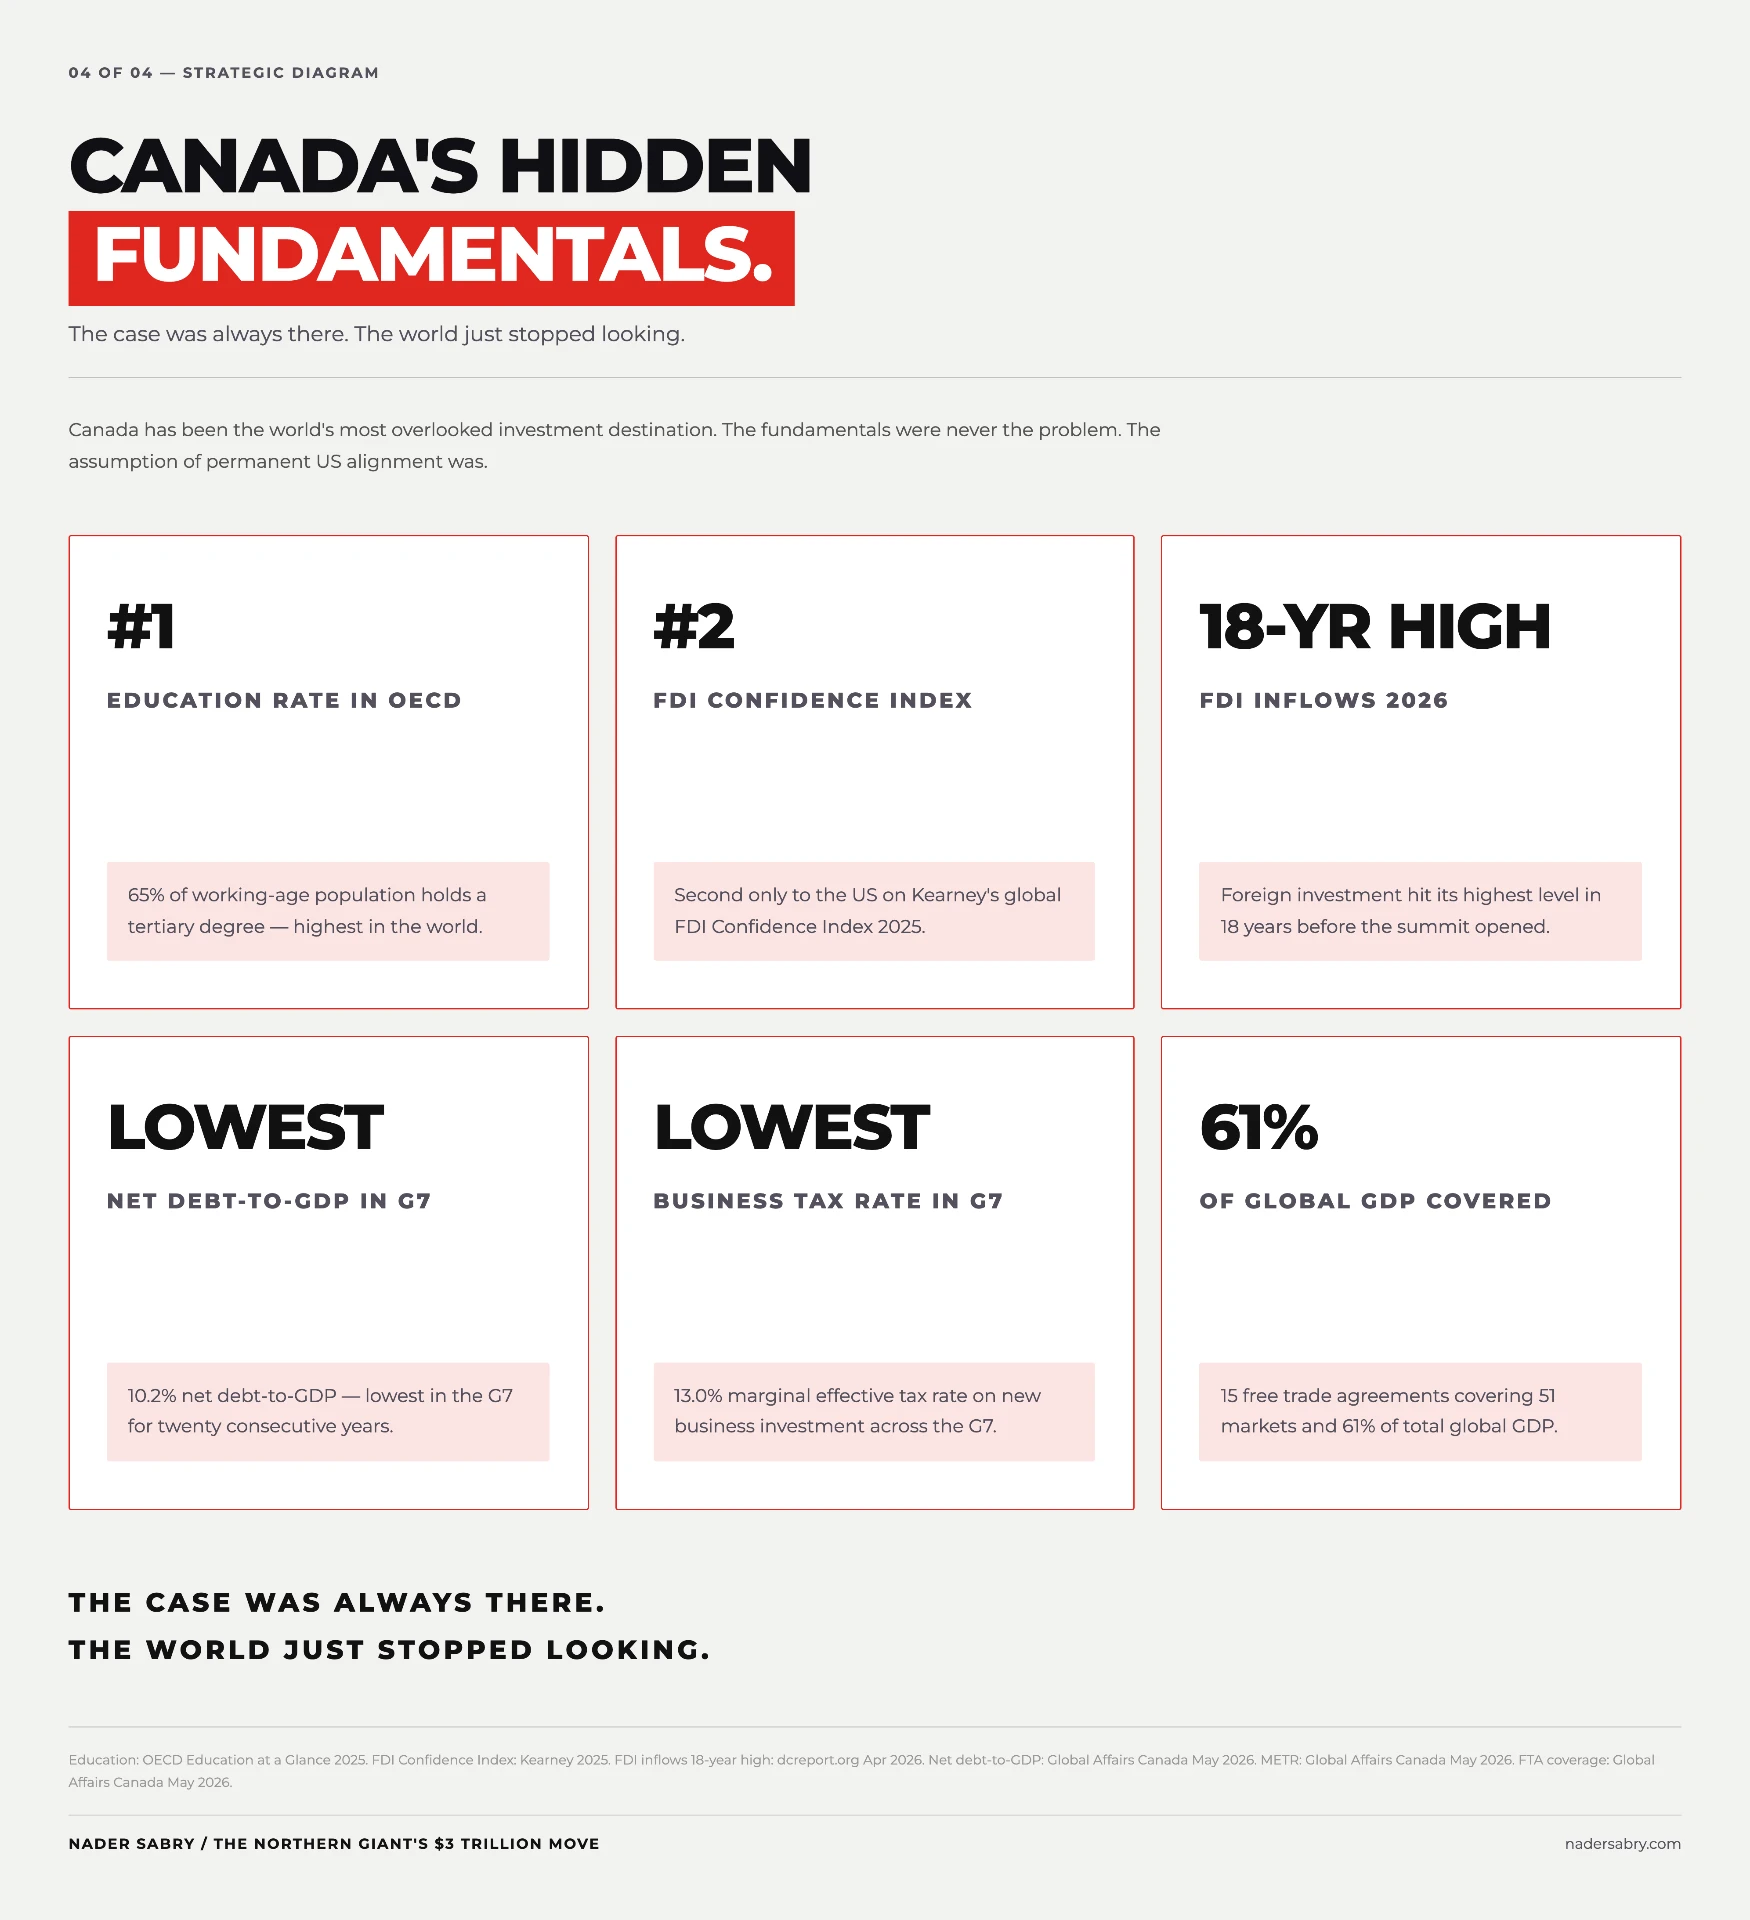
The foundation was never in question. What was missing was the world’s attention. As the next sections show, attention is no longer the constraint. Something else now is.
What Canada Actually Holds
Before getting to what’s changing, here’s what Canada has always held.
Energy
- 4th largest proven oil reserves globally — 163 billion barrels, 9.2% of the world’s total (Worldometer)
- Alberta produced roughly 4.5 million barrels per day in 2025 — 83.8% of Canada’s national total, and Alberta’s largest year-over-year gain on record (+182,000 barrels per day, +4%) (Canada Energy Regulator)
- Natural gas reserves up 440% in the latest Alberta Energy Regulator assessment
Critical Minerals — in a Single Jurisdiction
- 31 minerals on Canada’s own official critical minerals list, with significant overlap across the US, EU, UK, and other allied critical-minerals lists
- Potash: Canada leads the world with 32% of global production and 41% of global exports (Invest in Canada)
- Nickel: Canada is the world’s 4th-largest producer, accounting for roughly 3.5% of global mine production (Natural Resources Canada)
- Uranium: Cameco is among the world’s largest producers
- Lithium, cobalt, copper — all present, all domestic
Beyond Resources
- Approximately 20% of the world’s freshwater reserves
- Hydro, nuclear, and LNG clean energy infrastructure
- 15 active free trade agreements covering 51 markets — 61% of global GDP
- 65% of the working-age population has completed tertiary education — the highest rate in the OECD (OECD Education at a Glance 2025)
No other single jurisdiction on earth holds this combination.
That last figure — the education statistic — is not a soft credential. It is a strategic asset. And it has a direct consequence that the next section makes plain.
The Shift Was Already Underway
Here is what most commentary gets wrong: it frames the US tariff shock as the cause of Canada’s current moment.
It was the accelerant. The shift was already happening.
Over the twenty years before any trade war, before any political rupture (Statistics Canada):
- The US share of FDI stock in Canada declined from 64.1% to 45.5% over the twenty years ending in 2024
- The US share of Canadian merchandise exports declined from 83.9% in 2002 to 72.5% in 2025
- Canada steadily expanded its trade architecture, now holding 15 FTAs covering 61% of global GDP
Scotiabank’s own trade data shows the trend already moving: the US share of Canadian exports averaged 76% in 2024, fell to 72% in 2025, and had reached 70% by June 2026 — a decline that predates and continues through the tariff escalation, not a one-time reaction to it.
What the tariffs did was remove the political assumption of permanent continental alignment. That assumption — not the fundamentals — was what kept global capital from looking at Canada clearly.
Once it was gone, what the world saw surprised it. Canada was not becoming a serious investment destination in 2026. It already was one. The United States had simply been the reason nobody else noticed.
Carney’s Architecture — The Full Map
Prime Minister Mark Carney has spent the past year building what looks, on the surface, like a series of bilateral deals.
It is not. It is an architecture.
The confirmed deals, by value:
- UAE — $70B (~US$50B) investment pledge across critical minerals, energy, ports, and AI, signed alongside a new Canada-UAE Foreign Investment Promotion and Protection Agreement (FIPA) establishing legal ground rules for investors: C$70B pledged (deployment pending — see The Absorption Gap — Now Tested in Real Time)
- Critical minerals — 30 partnerships with Panasonic, Apple, Siemens, Rio Tinto and others: C$12.1B confirmed, projects active
- India — Uranium supply via Cameco, 22 million pounds over 9 years: C$2.6B confirmed, contract signed
- Indonesia — First-ever Canada-ASEAN bilateral financing via EDC: C$825M confirmed
- EU — Security and defence integration, only non-European nation in SAFE program: confirmed (no public $ figure)
- China — Canola tariff reduction from 85% to 15%: approximately C$3B in near-term trade value
Pipeline targeting end of 2026: India FTA, ASEAN, Mercosur, Saudi Arabia, Qatar, Turkey.
Result: $97 billion in FDI commitments secured in a single year. A $1 trillion target by 2030.
These are not isolated wins. Each deal is a demand channel — a confirmed external market for Canadian energy, minerals, and technology. Together, they form the supply side of an argument Canada has never been able to make before: the world has told Canada precisely what it wants. The task now is building the mechanism to deliver it at scale.
That is where the architecture gets interesting — and where the Summit becomes the first real stress test of it.
The Export Nobody Counted
Free. World-class. Universal. Canada built the finest education system, healthcare infrastructure, social safety net, and justice framework on earth — and placed it directly on the border of the most competitive economy in the world. What did anyone expect would happen?
The result was inevitable — and it showed up precisely where you would expect: in the companies that define the modern global economy.
Ask most people to name the founders of those companies. They will name Americans.
They are wrong.
- Ilya Sutskever — born in Russia, educated at the University of Toronto. Co-founded OpenAI. Co-invented AlexNet. The intellectual architecture behind ChatGPT.
- James Gosling — born in Calgary, Alberta. Invented Java at Sun Microsystems. The language that runs the backbone of global enterprise computing.
- Michelle Zatlyn — born in Prince Albert, Saskatchewan. Co-founded Cloudflare ($65B+). Her infrastructure secures approximately one-third of the internet.
- Matei Zaharia — educated at the University of Waterloo. Co-founded Databricks ($62B). Created Apache Spark — the data infrastructure backbone of modern AI.
- Stewart Butterfield — born in British Columbia. Co-founded Flickr and Slack. Slack sold to Salesforce for $27.7 billion.
Canada did not lack talent. It educated it, developed it — and exported it.
For fifty years, the True North trained the world. And the world kept the returns. The same pattern — world-class inputs, exported outputs — turns out to describe more than talent. It describes capital, too, as the next two sections show.
The Absorption Gap — Now Tested in Real Time
Here is where honesty requires precision.
The demand is confirmed. The readiness is being tested — in public, in real time, by the very summit designed to prove it exists. The absorption gap — the distance between what Canada can attract and what it can actually deploy — is not pessimism. It is the argument for why the strategic architecture in The Strategic Architecture must be built now, and the September summit is the clearest evidence yet of both halves of that argument at once.
What the World Just Offered
- Nearly $500 billion pledged across a single week in September 2026 — TD ($150B over five years), Scotiabank ($100B+ over five years), BMO ($70B over ten years), CPP Investments and Brookfield’s new $50 billion “Maple Fund,” PSP Investments ($25B), Ontario Teachers’ ($10B by 2027), Sun Life ($5B), and Bell Canada’s Saskatchewan AI data-centre expansion (over $50B)
- $1.8 trillion in investment opportunities identified across energy, critical minerals, infrastructure, and technology (RBC analysis)
- $1 trillion investment target set by Canada for 2030
What “Pledged” Actually Means
This is where the Summit becomes useful rather than just impressive. Most of the $500 billion is not capital sitting in an account waiting to be spent — and the government’s own announcement does not pretend otherwise. The banks’ roughly $325 billion is financing capacity: facilities they are prepared to lend against, over five to ten years, if bankable projects show up. The pension funds’ roughly $100 billion is closer to real committed capital — CPP Investments and Brookfield are each putting up to C$25 billion of their own balance sheets into the Maple Fund over five years, targeting individual projects worth more than C$5 billion in equity value. Bell’s Saskatchewan project is the clearest illustration of the gap between headline and reality: of the “more than $50 billion” cited, only the first 300 megawatts is drawing on committed provincial grid capacity today; the remaining 900 megawatts needed to reach the stated 1.2-gigawatt goal depends on Bell arranging its own power generation — a “bring your own power” condition that has not yet been met.
None of this is a criticism of the Summit. It is the absorption gap, demonstrated with better data than this essay had a year ago.
What the $430 Billion Actually Is
An independent analysis by The Logic went further than the government’s own headline number, working directly from the Summit’s 167-project prospectus. Of those, 155 projects had disclosed capital figures, totalling roughly $430 billion — a narrower, more conservative measure than the “nearly $500 billion” commitment figure, because it counts specific, named projects rather than aggregate pledges.
Broken down by sector, the capital skews toward what Canada has always been good at, not toward what the Summit’s own AI-and-technology framing might suggest: conventional energy (~$98B) and clean energy (~$94B) together account for nearly half the total, followed by marine and port infrastructure (~$67B), minerals and metals (~$53.5B), power and utilities (~$49B), transportation (~$27B), digital technology (~$27B), and advanced manufacturing (~$15B). By project count rather than capital, minerals dominate — 63 of the 167 projects, 38% of the total — even though they rank fourth by dollar value. That gap between project count and capital concentration is itself informative: Canada has breadth in mineral development activity, but the largest cheques are still being written for energy and port infrastructure, the categories with the longest track record of attracting capital at scale.
Geographically, the money follows the resource base rather than the population centres. Alberta leads at $70.5 billion, followed by British Columbia ($61.4B) and Manitoba ($61.1B) — with $90.9 billion more spread across multi-provincial projects. Two things are missing from that list, and neither is an oversight. No housing projects appear anywhere in the 167-project prospectus, which tells the reader plainly what kind of capital this Summit was designed to attract, and what kind it was not. And the published breakdown offers no way to separate genuinely new capital from previously announced commitments folded into the total, or to see how much of the disclosed figure is equity versus debt versus contingent facility. That is not a criticism of the analysts who compiled it — the government did not publish that level of granularity either. That gap matters, because it’s exactly the kind of honesty this essay’s central argument depends on: the headline total is real, the sectoral and geographic pattern is real and informative, but the precision needed to say how much of $430–500 billion is genuinely new, deployable capital does not yet exist in public form.
What Canada Can Currently Absorb
- C$70 billion UAE commitment: still largely undeployed as of the Summit. Multiple independent outlets reported in mid-2026 that Canada told the UAE it was not yet ready to absorb the pledged capital — the commitment is real, the project pipeline to receive it was not. Steps are underway, but the gap between announcement and deployment remains real.
- Canada takes approximately 20 years to permit and build a mine. Australia: 14 years (PwC Canada, Mine 2026) — and this is the barrier the Summit’s own commitments now have to move through.
- The friction itself is now being engineered down, not just diagnosed: the CRA began prioritizing advance income-tax rulings for investments of C$1 billion or more in September 2026, giving investors binding tax certainty before they commit capital, while Ottawa is separately reviewing long-term private concessions for the country’s four largest airports — recycling capital already locked in existing infrastructure into new productive assets. Deloitte’s own survey work finds regulatory burden the #1 investment concern in Business Council of Canada CEO surveys, which is exactly the friction this is aimed at.
- New federal legislation targets compressing major-project approval timelines from roughly five years to two, through a proposed Crown Consultation Hub and a single “Authorization Document” regime. Legal analysts warn the compression carries real risk: faster timelines may draw more litigation from project opponents, and it remains unclear how the Crown will deliver meaningful Indigenous consultation inside a two-year window — constitutional challenges to the acceleration measures have already been filed. This, not the size of any single pledge, is the real test of whether the Summit’s capital becomes projects.
- On the direction of capital itself, the picture is more encouraging than it was even a year ago, though not yet resolved: Canada’s stock of outward direct investment still exceeds its stock of inward FDI — the accumulated legacy of decades in which Canadian capital left faster than foreign capital arrived. But in 2025, the annual flow reversed: C$96.8 billion came in against C$79.4 billion that went out, a net inflow. The tide has turned. It has not yet closed the gap it spent decades opening.
- Pre-Summit, the real economy was not sitting still, but it was not broad-based either: the Bank of Canada’s most recent Business Outlook Survey found firms’ investment intentions “broadly unchanged… and remain at a high level” — but the strength was concentrated in resource-sector capital spending riding elevated commodity prices, not a general upswing across the economy.
- Against all of this, Boston Consulting Group puts a number on the structural gap the Summit is trying to close: roughly $140 billion in additional annual investment needed through 2030 to close Canada’s investment-intensity gap with peer economies — worth about 4.5% of GDP. Measured against that number, even a genuine $500 billion in Summit pledges, spread across five to ten years, is a meaningful down payment. It is not the number itself, deployed once.
The gap is not rhetorical. It is mathematical — and now it has a Summit’s worth of evidence on both sides of the ledger.
But here’s the reframe that matters: the absorption gap is not a failure. It is the opening.
The demand channels exist. A meaningful share of the capital is now genuinely committed, not merely confirmed as willing. The gap between what Canada holds and what it can currently absorb at scale is precisely the space where the right policy, the right mechanism, and the right architecture must now operate. Close the gap and the $3 trillion prediction is conservative. Leave it open and the capital — even the capital that showed up in Toronto — will find other destinations, or simply never convert from pledge to project.
That raises an uncomfortable but necessary question. Is the absorption gap a one-week problem, exposed by an unusually ambitious summit? Or is it something older and more structural — a decade in the making, and the real reason Canada needed a summit like this in the first place?
The Deeper Gap — A Decade in the Making
The Summit is a stress test of Canada’s absorption capacity. It is not the first evidence of a problem. It is the latest.
An independent structural analysis by the Boston Consulting Group already puts a number on the annual shortfall — roughly $140 billion. What that number does not explain on its own is why the shortfall exists, or how long it has been building.
BCG’s own analysis answers part of that with more than one number. The same research finds investment underperformance across 12 of Canada’s 13 provinces and territories, 16 of 18 industries, and all five major asset classes — a pattern too broad to be one bad sector or one bad year. Roughly 60% of that decade of underperformance traces specifically to mining and oil & gas extraction, the industries that have historically supplied Canada’s largest pool of private capital formation. That is one independent, multi-dimensional data set. A separate line of research — from a US-based think tank, the Information Technology and Innovation Foundation, in a 2026 report bluntly titled “Comfortable Decline” — supplies a second, longer arc, and it is less comfortable reading than either the Summit or the fund math above.
The comparison the report draws is not between Canada and an average global peer. It is between Canada and the United States, the single economy Canada is most exposed to and most frequently benchmarked against. Canadian labour productivity sits at roughly $74.70 per hour worked, against roughly $97.00 in the United States — Canada generating about three-quarters as much economic output per hour of work as its southern neighbour. Adjusted for purchasing power, Canadian GDP per capita is roughly $51,682 against $72,375 in the US — a gap of about 40%, and one that has been widening rather than closing: from 2014 to 2024, real GDP per capita grew 3.2% in Canada against 20.2% in the United States.
The capital-formation numbers behind that gap are the part most directly relevant to this essay’s argument. Canadian workers, on the report’s accounting, receive roughly 55 cents of new capital investment for every dollar an American worker receives. Canada’s productive capital stock — the machinery, equipment, and structures that make a worker more productive — fell by 8 percentage points as a share of GDP between 2013 and 2023. Business research-and-development spending sits at 0.4% of GDP, against 2.6% in the United States; in absolute terms, Canadian firms spend roughly $9.3 billion on R&D annually, ranking 14th globally for an economy of Canada’s size. And by one composite measure of industrial competitiveness — the “advanced-industry location quotient,” tracking how concentrated an economy’s output is in the highest-value manufacturing and technology sectors — Canada’s score fell from 0.87 in 1995 to 0.59 in 2022, a decline the report notes now places Canada below Argentina and Indonesia among G7 economies.
Two caveats, applying the same precision this essay has used everywhere else.
The first is that this is single-source material from one think tank, and the author’s own framing — “comfortable decline,” a title chosen to provoke — carries a clear point of view. Atkinson’s explanatory argument, which blames interprovincial trade barriers, weak venture-capital markets, labour-market rigidities, small-business tax preferences that discourage firms from scaling, and an immigration-driven population growth strategy that has substituted for productivity investment, is his own causal analysis. It should be read as an argument, attributed to him, not adopted here as settled explanation. Reasonable economists disagree about how much weight each of those factors carries, and this essay does not attempt to adjudicate that debate.
The second is that the underlying statistics themselves — productivity per hour, GDP per capita, capital investment per worker, R&D spending, the location-quotient trend — are drawn substantially from Statistics Canada, OECD, and US Bureau of Economic Analysis source data, the same category of primary material this essay relies on elsewhere. They do not need Atkinson’s interpretation to be useful. Stripped of the report’s editorializing, what they show is a country whose capital-per-worker and R&D intensity have been falling behind its most relevant peer for over a decade — not for one bad quarter, and not because of anything that happened in Toronto in September 2026.
This is the deeper version of the absorption gap. The Summit tested whether Canada can absorb a sudden, concentrated week of capital interest. The structural data says the harder test predates the Summit by a decade: whether Canada’s economy — its permitting regime, its capital markets, its R&D base, its industrial mix — has been building the capacity to convert any capital, pledged in a week or arriving steadily over years, into productivity gains rather than into resource extraction alone. The Summit did not create that test. It simply made it visible, all at once, in a single news cycle.
This is also why the architecture proposed later in this essay cannot be a response to one good week. A sovereign wealth fund capitalized on resource revenue would do nothing, by itself, to close a productivity gap rooted in weak business R&D and thin capital stock per worker. It would concentrate national savings. Converting that savings into the kind of broad-based, compounding capacity the ITIF data says Canada has been losing for a decade is a separate, harder problem — one this essay does not claim to solve, and flags honestly as open.
Updated developments
Selected financing, contracts and investment decisions announced after the summit, with their current conditions.
- C$240MFinancing closed
Marathon mine · Ontario
Generation Mining closed a public offering and private placement.
Gross proceeds; final TSX approval remained outstanding in the release.
The total comprises a C$200M public offering and a C$40M private placement with Canada Growth Fund. The release also reports a Glencore offtake agreement for future Marathon concentrate production.
- C$1.7BContract signed
Pickering Unit 5 · Ontario
AtkinsRéalis–Aecon signed a three-year OPG refurbishment contract.
Joint venture contract value; broader refurbishment subject to regulatory approval.
The contract covers engineering and design, project delivery, and program and project management. C$1.7B is the joint venture’s contract value, not AtkinsRéalis’ individual share.
- C$500MFinal investment decision
Wolf Midstream · Alberta
Phase 3 expansion of the NGL North System approved.
Project budget; not expenditure to date.
The expansion includes a third recovery train, a third de-ethanizer tower, an expanded rail terminal and a cogeneration facility. Alberta’s project register lists the project at the proposed stage.
- C$145MFund established
Morguard ReNew · Canada
Retrofit fund established for approximately 30 properties.
Includes a C$100M Canada Infrastructure Bank loan; full deployment not confirmed.
The fund combines equity commitments from Morguard and its investors with the CIB loan. Participating buildings target a minimum 30% reduction in emissions; this is a target, not a measured result.
The Resource-to-Wealth Formula
To understand where Canada needs to go, look at a pattern — not just a country.
Every major sovereign wealth fund in the world was built on the same foundation: a resource surplus, a political decision to save it, and the discipline to compound it across generations. This is not Norway’s story. It is the story of sovereign capital itself.
How the World’s Great Funds Were Built
- Kuwait Investment Authority — founded 1953. Built on oil. Now one of the oldest and largest funds on earth.
- Abu Dhabi Investment Authority (ADIA) — founded 1976. Built on Gulf oil. Grew from near-zero to one of the world’s top three funds.
- Alaska Permanent Fund — founded 1976. Built on North Slope oil. Now $85B+, paying annual dividends to every Alaskan resident.
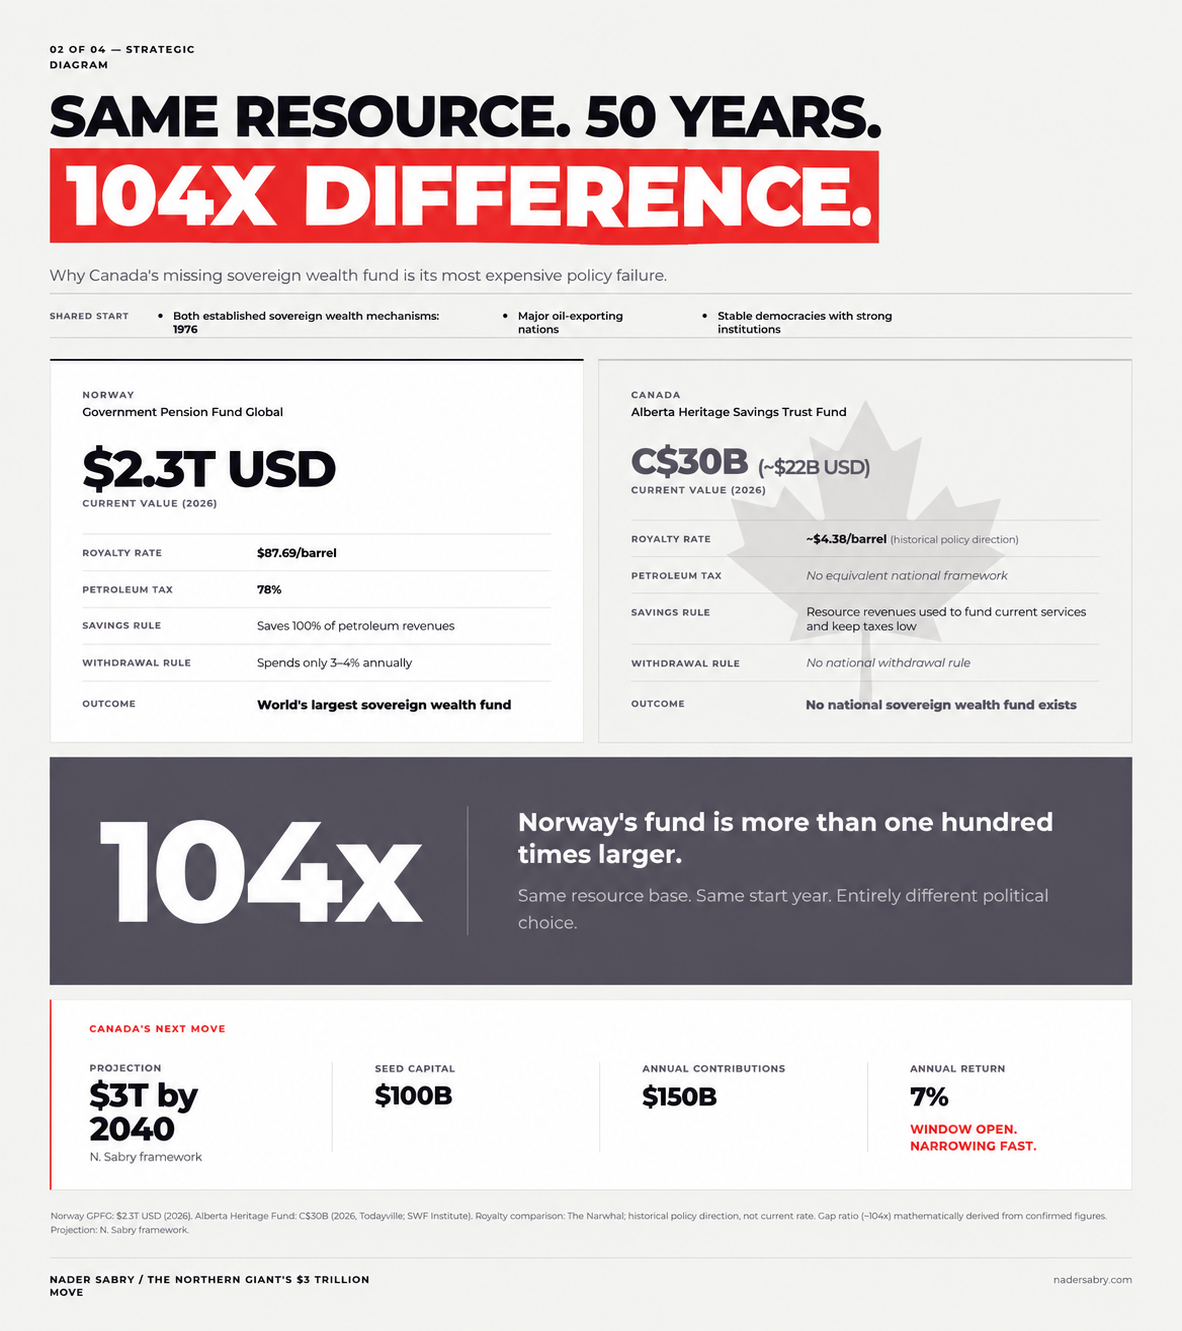
- Alberta Heritage Savings Trust Fund — founded 1976. Same year as Alaska and ADIA. Built on the same resource base. Current value: C$30 billion.
- Norway Government Pension Fund Global — founded 1990. Built on North Sea oil. Current value: $2.3 trillion USD (2026).
The divergence between Alberta and Norway is not geological. It is political. Alberta channelled resource revenues into current services and low taxes — a de facto dividend to present citizens at the cost of future generations. Norway applied a 78% total petroleum tax rate, saved 100% of petroleum revenues, and withdrew only 3–4% annually as a fiscal buffer. Same era. Same resource logic. A more than hundredfold difference in outcome.
Why Canada’s Case Is Stronger Than Norway’s
Norway built a $2.3 trillion fund from a single resource. Canada’s base is broader than any sovereign fund founder in history:
- Oil and gas — 163 billion barrels, 9.2% of global proven reserves. This is the product.
- 31 minerals on Canada’s own critical minerals list, overlapping significantly with allied lists — lithium, cobalt, nickel, uranium, potash. This is the insurance policy.
- Freshwater, clean energy, agricultural land — the resources the second half of the 21st century will price differently than the first.
In April 2026, Carney announced the Canada Strong Fund — billed as Canada’s first national sovereign wealth fund. Initial capital: $25 billion, financed through government spending rather than resource revenues — the opposite of Norway’s model, which draws exclusively from petroleum revenue and is prohibited from domestic investment by design. The mechanism has been named. The architecture this essay describes — resource-royalty-funded, compounding at sovereign scale, reaching $3 trillion by 2040 — has not yet been built.
Five months later, at the September Summit, CPP Investments and Brookfield answered part of that question without being asked: a $50 billion Maple Fund, built to write cheques on projects north of $5 billion — the scale a national architecture would actually need. PSP Investments, separately, says it already deployed C$10 billion into Canada in its last fiscal year and expects its Canadian pension exposure to grow 30–40% and pass C$100 billion within a few years — a named, quantified commitment sitting alongside its C$25 billion Summit pledge, not instead of it. It is evidence that the country’s largest pools of capital believe big, coordinated Canadian bets are investable. It is not evidence that the coordination problem is solved. A collection of large funds is not an architecture until there are enough of them that fragmentation, not scarcity, becomes the risk — and no one has yet answered who assembles the pieces into one system.
The scale of what already exists, deployed rather than merely pledged, puts that fragmentation problem in perspective. The Canada Growth Fund — a $15 billion public investment vehicle managed on the government’s behalf by a subsidiary of PSP Investments — had, as of February 2026, closed 19 transactions committing $5 billion across six provinces. One of them: up to US$85 million toward rehabilitating the Thompson Nickel Mine Complex in Manitoba, alongside Vale Base Metals, a junior miner, and a private resource-investment firm, to secure continued production of a critical mineral central to EV battery supply chains. It is a real, deployed, closed transaction — precisely the kind of evidence the absorption-gap argument above says is scarce. It is also a reminder of scale: $5 billion committed across nineteen transactions over roughly two years is a rounding error against a $140 billion annual structural gap, or against the $430–500 billion the Summit produced in a single week. Canada does not lack institutions willing to deploy capital into real projects. It lacks enough of them, moving at a scale and a speed that matches the size of the opportunity now sitting in front of the country.
That is the gap. And the gap is also the opportunity.
The Strategic Architecture
Put it together and the logic is airtight.
Canada holds the resources the world has confirmed it needs. Carney has built the demand channels. The absorption gap is real, and it runs deeper than one summit — but the September Summit is the first hard evidence it is narrowing rather than static. Every major sovereign fund in history started from exactly this position. The architecture to capture this moment has Four Forces.
Force 1 — Energy
Canada’s resource base is the broadest of any sovereign wealth fund founder in history. Oil and gas as the revenue engine. Critical minerals as the long-cycle asset. Clean energy, freshwater, and agriculture as the 21st-century hedge. No other jurisdiction holds this combination in a single political unit with Canada’s stability and trade access.
163 billion barrels — 9.2% of the world’s proven reserves. The largest untapped energy mandate on earth.
Force 2 — Minerals
Carney’s FTAs and investment agreements are not bilateral wins. They are confirmed demand channels — the external pathways through which $1.8 trillion in identified global capital wants to flow into Canada. Each deal is an enabler that makes the fund’s revenue base larger and more diversified than Norway ever had. The Summit’s own numbers confirm the pattern: minerals accounted for more individual projects than any other sector in the 167-project prospectus, even though they trailed energy and infrastructure in total dollar value — evidence of breadth, not yet evidence of scale.
31 minerals on Canada’s own critical minerals list, with significant overlap across the US, EU, UK, and other allied lists. No other single jurisdiction holds this combination.
Force 3 — Capital
The absorption gap, solved through permitting reform and a national sovereign wealth fund as the deployment vehicle, becomes the leverage point. A fund draws co-investment from private capital and foreign sovereigns who want exposure to Canadian assets but need a credible counterparty. The fund is not just a savings vehicle — it is a platform that multiplies the underlying resource value. Closing the deeper structural gap identified in The Deeper Gap — A Decade in the Making — Canada’s decade-long shortfall in capital per worker and business R&D — is a distinct, harder task than capitalizing a fund from resource royalties, and this essay does not claim the fund alone solves it.
RBC estimates $1.8 trillion in investment opportunity wants to enter Canada. The mechanism to receive and coordinate it at national scale does not yet exist — the Summit and the Canada Growth Fund produced pieces of one, not the thing itself.
The scale of the mismatch is not abstract. Canadian pension funds alone manage more than C$2.5 trillion in assets — and invest less than 1% of it in domestic venture capital, according to the Toronto Region Board of Trade. That is not a capital shortage. It is a plumbing problem: the money exists, but the mechanism connecting it to Canadian companies that need to scale does not. Building that mechanism is what Force 3 is.
Force 4 — Talent
Talent infrastructure is what makes the architecture durable. Canada has produced the talent that built the global tech economy. It has exported the returns. Reversing that — through the fund’s investment mandate, through sector-building in critical minerals and clean tech, through retaining graduates rather than training them for export — is what converts a resource windfall into a permanent economic upgrade. It is also the force most directly implicated by the productivity gap in The Deeper Gap — A Decade in the Making: a country whose businesses invest 0.4% of GDP in R&D will struggle to retain the talent it trains, regardless of how large its sovereign fund becomes.
65% of Canada’s working-age population has completed tertiary education — the highest rate in the OECD.
The Four Forces do not operate in isolation. The native workforce is the connective tissue — the element that transforms resource extraction into innovation, capital formation into sustained growth, and policy architecture into lived prosperity. Without talent, the forces are inert. With it, they compound.
The Prediction — Grounded in Math
Norway built a $2.3 trillion fund from one resource over thirty years. Canada starts with a broader resource base and confirmed global demand across every category. The numbers follow from a single model — here is how the Four Forces unfold as a timeline.
Phase 1 — Force of Energy — 2027–2030 — → $300B
Oil and gas revenues become sovereign capital — for the first time.
- SWF established; fund capitalized from energy revenues
- $50–80B annual contributions begin
- Provincial revenues channeled into national framework
Phase 2 — Force of Minerals — 2030–2035 — → $800B
Critical minerals double the contribution rate.
- Lithium, cobalt, nickel, uranium revenues flow into the fund
- Compounding returns overtake annual contributions
- Canada’s exports shift from commodity to strategic supply
Phase 3 — Force of Capital — 2035–2038 — → $1.5T
The fund becomes a capital force in its own right.
- Fund crosses $1 trillion
- Allied SWF co-investment amplifies deployment
- FDI pipeline converts into direct fund contributions
Phase 4 — Force of Talent — 2038–2040 — → $3T
The workforce becomes the multiplier.
- AI, clean energy, and biotech returns compound into the fund
- STEM pipeline generates sovereign-scale equity positions
- $3T reached: Canada joins Norway as a generational model
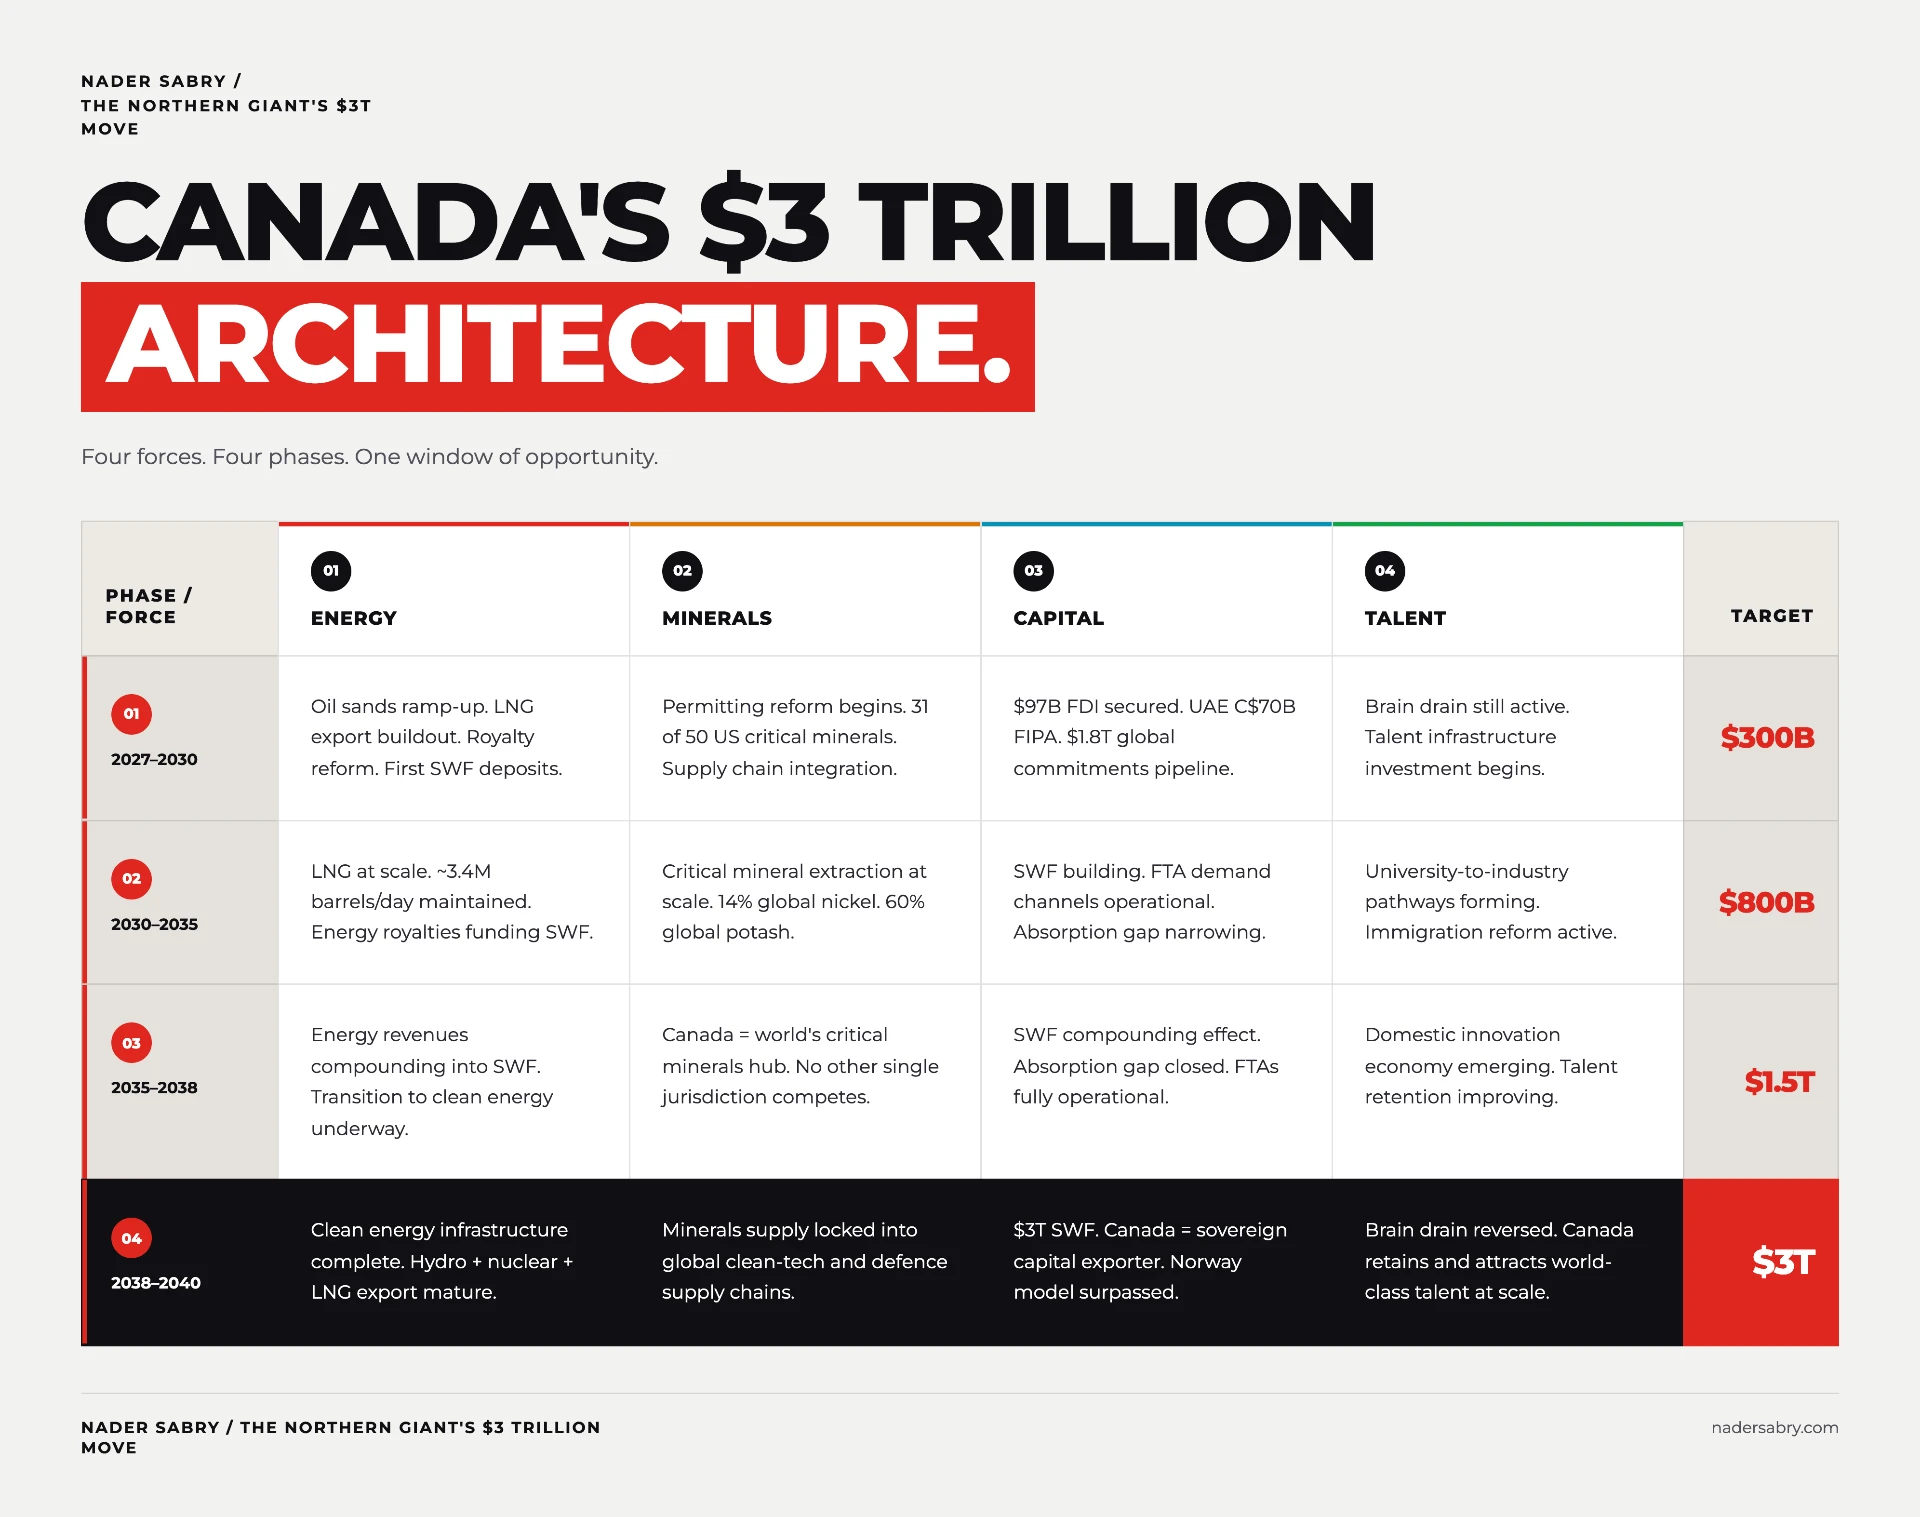
This model is not the only one pointing toward this order of magnitude. TD Economics separately identifies more than $1 trillion in announced Canadian projects already on the table through 2035, and models a high-investment scenario reaching $1.5–1.7 trillion in additional nominal investment over the longer term. Two independent models, built on different methodologies, converging on the same scale is not proof — but it is corroboration.
The underlying math:
- Starting base: $100 billion (initial capitalisation from resource revenues and government seed)
- Annual contributions: $150 billion per year — a conservative estimate derived from royalty capture rates on confirmed energy and minerals revenues, supplemented by partial FDI receipts
- Return rate: 7% per year (consistent with Norway’s long-run return of 6.3% and standard sovereign fund benchmarks)
- Outcome: $3 trillion by 2040 — the largest sovereign wealth fund in the world
Norway got there from one resource. Canada is starting with more. The math is not optimistic. It is straightforward — provided the deeper capacity gap in The Deeper Gap — A Decade in the Making closes alongside it, not after it.
This is not a policy argument. It is a sequence. Force of Energy. Force of Minerals. Force of Capital. Force of Talent. In that order, at that scale, beginning now.
The Three Roads to $3 Trillion
The architecture is clear. The dilemma is real.
Carney’s Canada Strong Fund — $25 billion in initial federal capital — is the first move. The Maple Fund, the Canada Growth Fund, and the banks’ financing facilities are the second, third, and fourth. None of them, alone or together, answers the underlying question: is this the architecture, or a placeholder for a decision that has not yet been made?
A national sovereign wealth fund at the scale this moment requires needs capital. Where it comes from determines everything — the politics, the governance, the timeline, and who bears the cost and who captures the return.
Three pathways. Each legitimate. Each difficult.
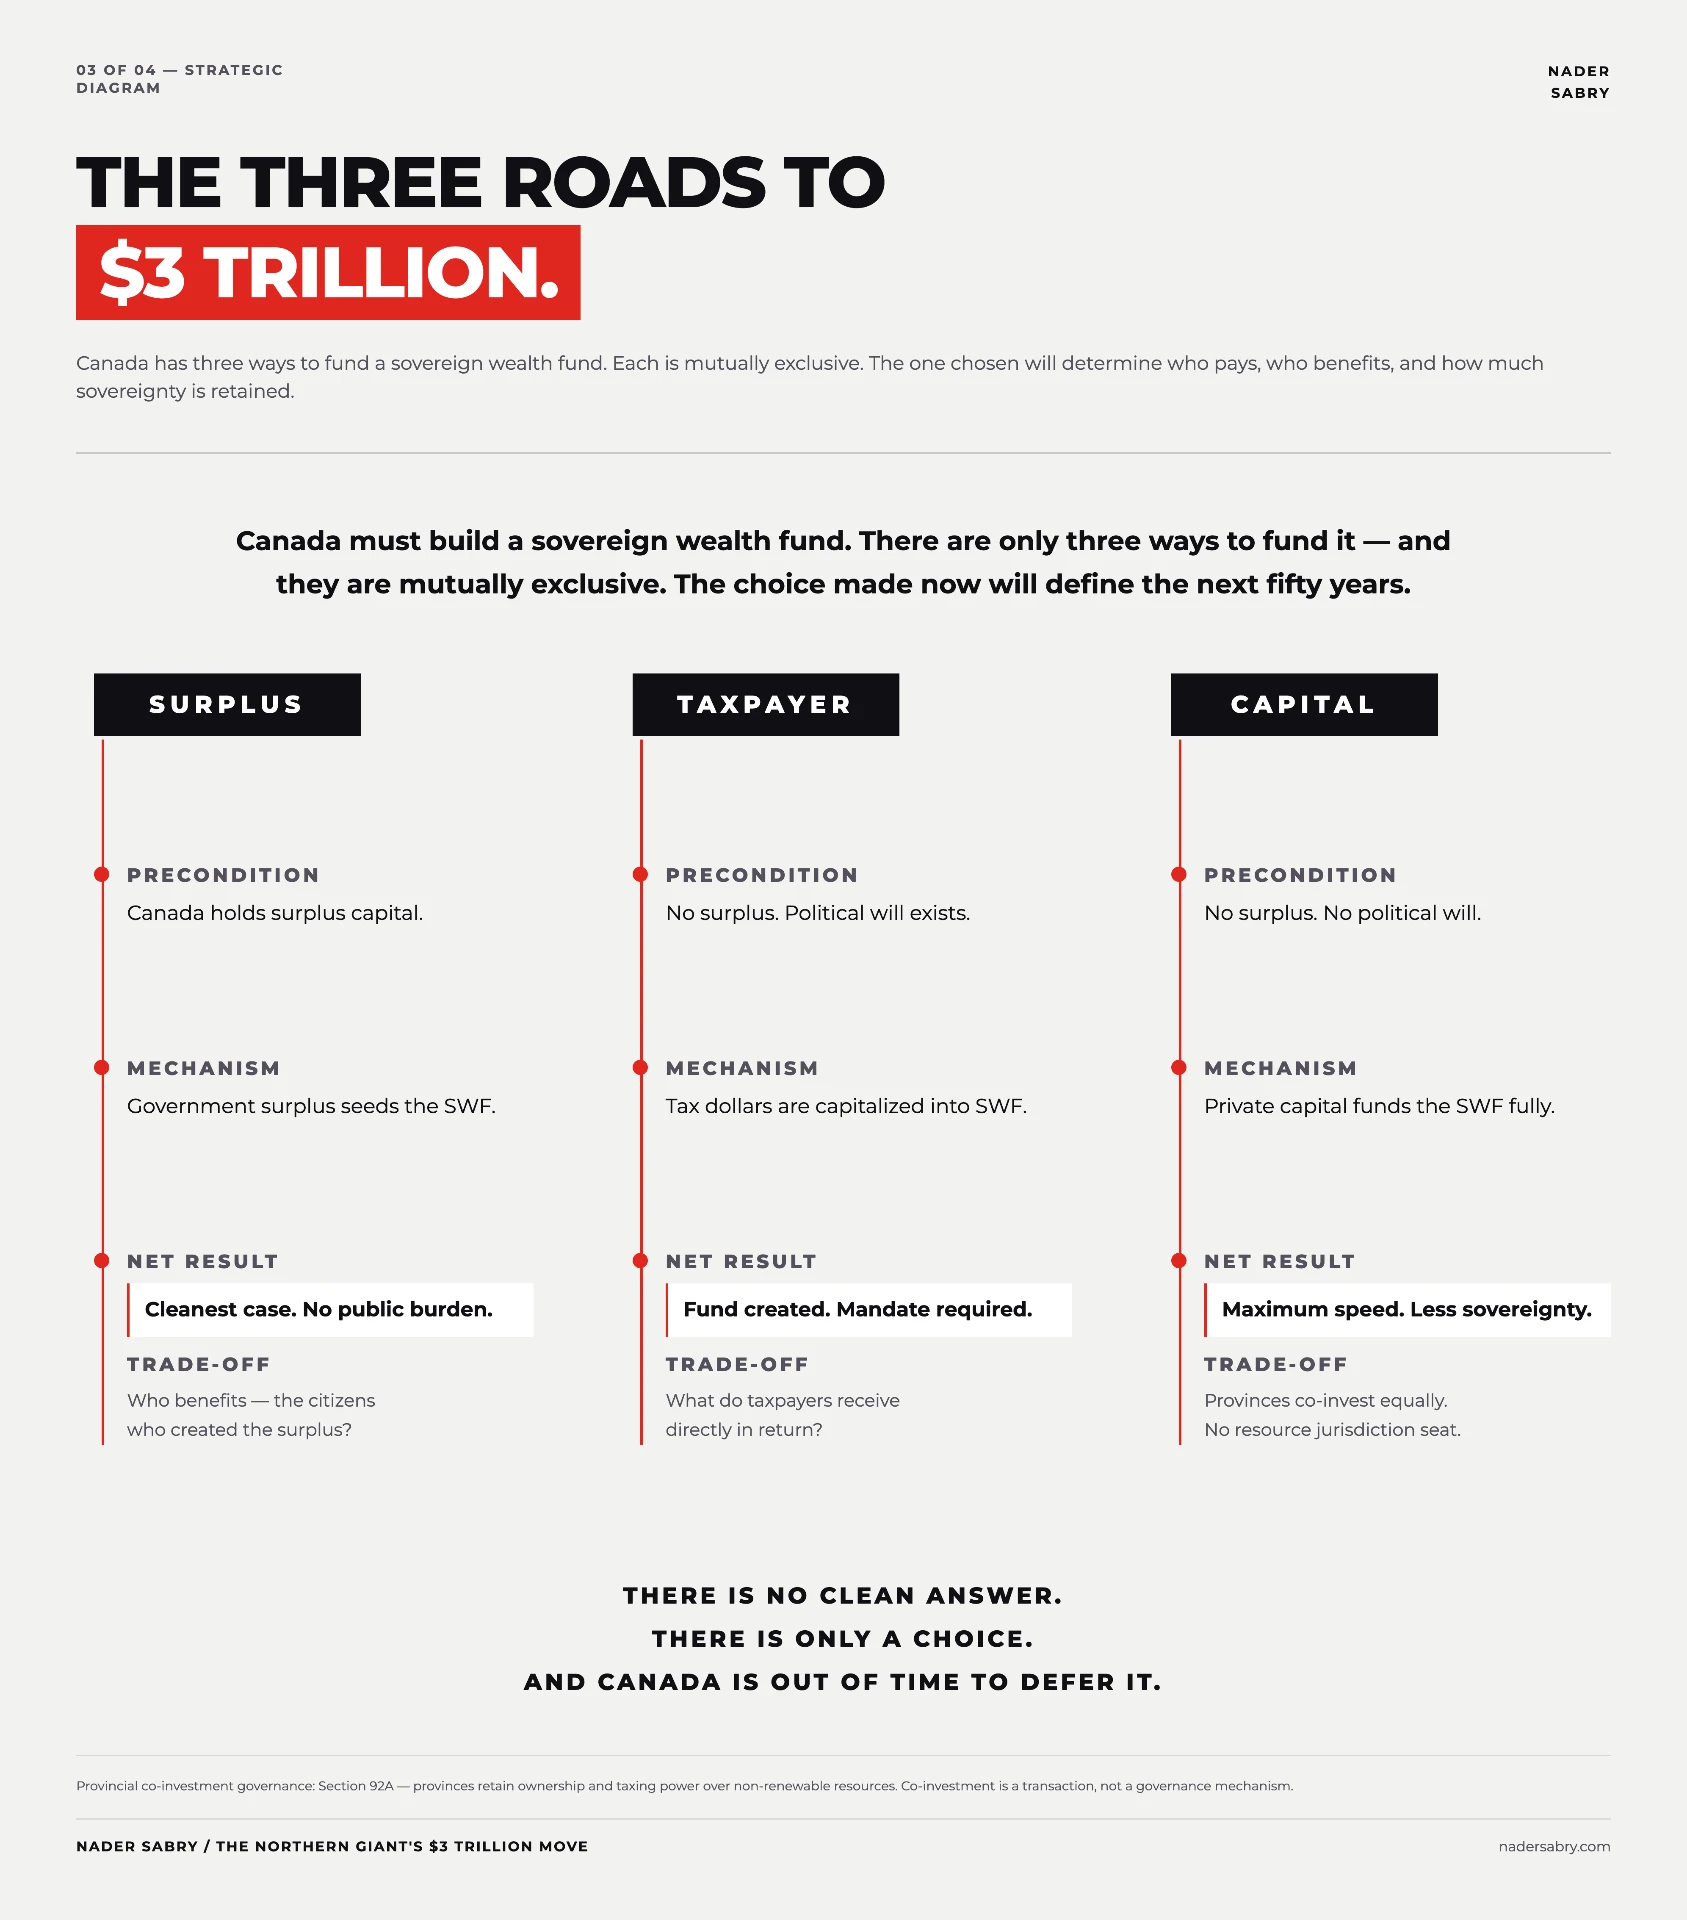
Pathway 1 — The Surplus Route
Precondition: Canada has surplus capital.
The cleanest case. Existing government surplus is deployed as seed capital. No new taxes. No new obligations. No private entanglement.
The tension: if that surplus was built through taxation, citizens have a legitimate claim on how it is used. The fund must answer one question — how does the general population benefit from an architecture built on their contribution? Define that return clearly and the politics are manageable. Leave it undefined and the surplus becomes a political target.
Pathway 2 — The Taxpayer Compact
Precondition: Canada does not have a surplus.
No surplus means the fund is capitalized directly through citizens — a designated levy, a ring-fenced allocation, a new contribution framework. The base is broader. The accumulation is faster. The political cost is immediate.
Every taxpayer will ask one question: if I am funding this, what do I get back, and when? Without a credible, explicit return mechanism — services, dividends, or a guaranteed future benefit — this compact collapses politically within one term. The Taxpayer Compact only works if the compact is real.
Pathway 3 — The Private Capital Gateway
Precondition: Neither surplus nor political will for taxpayer funding exists.
The fund is capitalized entirely from scratch through private capital. Canadian citizens and domestic institutions take priority. International capital enters after. Scale is achievable faster than either public pathway.
But this pathway carries a structural contradiction: a sovereign wealth fund that depends on external capital is not fully sovereign. Private investors bring return expectations, governance conditions, and interests that do not always align with national priorities. Get the structure wrong and Canada trades one dependency for another — and the architecture designed for independence becomes a new form of obligation.
What the Awakening Actually Means
Canada is not waking from sleep.
It is making a decision — and in September, for the first time, the world made its own opening bid on what that decision is worth.
For fifty years, the True North built world-class talent, extracted world-class resources, and exported the returns — to Silicon Valley, to Wall Street, to sovereign funds in Oslo and the Gulf. The infrastructure that made all of it possible — the healthcare, the universities, the immigration system — is now showing the strain of that arrangement, and a decade of relatively weak business investment and thin productivity growth, documented independently of anything that happened this September, is part of that strain.
The awakening is the moment Canada decides that the next fifty years will work differently.
Not with anger. Not with retreat. With the quiet, methodical determination that has always been this country’s defining character.
The world built its most advanced companies on Canadian talent. The world just pledged nearly half a trillion dollars in a single week to invest in Canadian resources. The question is no longer whether the world is interested. It is whether Canada builds the architecture to convert that interest into projects, productive capacity, and compounding national advantage — before the pledges expire, the power isn’t built, and the capital finds a jurisdiction that moves faster. It is also whether Canada addresses the older, quieter problem the Summit did not create: a decade of underinvestment that no single week, however historic, fully reverses on its own.
The True North was always strong.
The question — the only question — is whether it will now choose sovereign wealth over sovereign dependency.
There is no clean answer. There is only a choice. And Canada is out of time to defer it.
The $3 trillion by 2040 is not a ceiling. It is a floor — if Canada moves now. Every year of inaction is a year of compounding Norway will have had and Canada will not. September proved the world is willing to bet on Canada in size. It did not prove Canada will spend the money it just raised, and it did not, by itself, close a productivity and capital-investment gap a decade in the making.