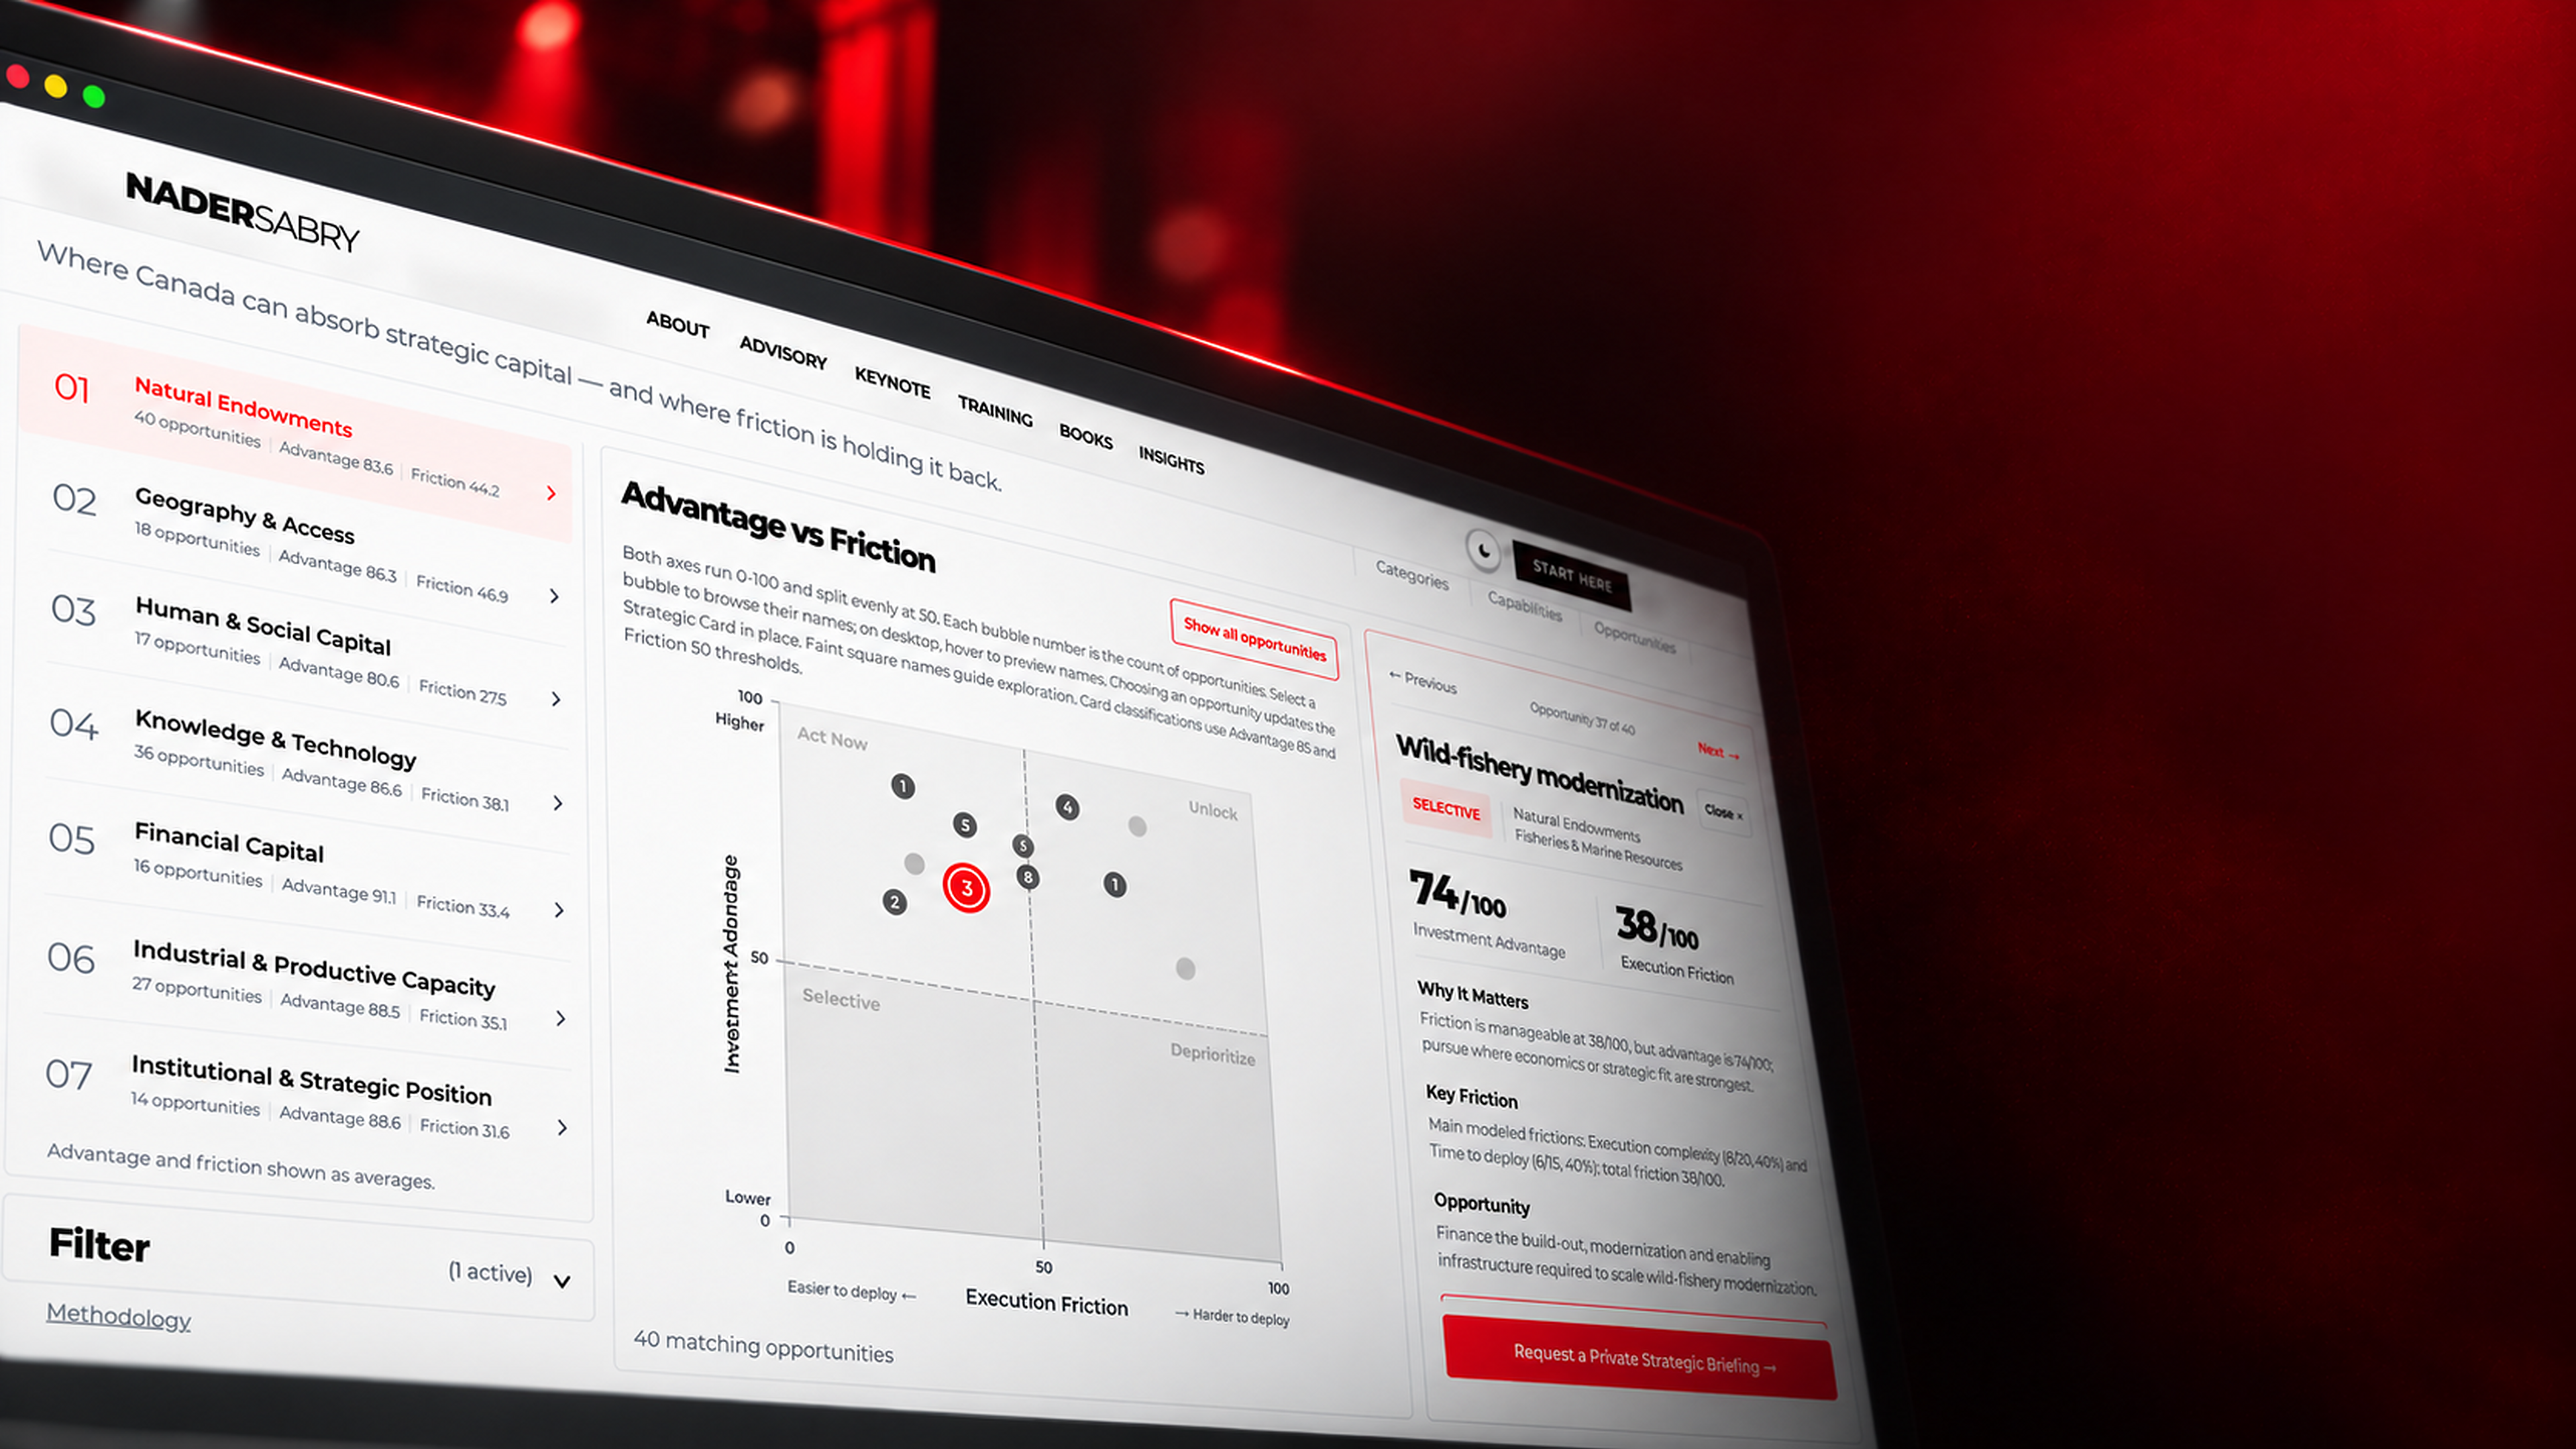
Media release · Strategic intelligence · Canada
From the $3 Trillion Vision to 168 Investable Opportunities
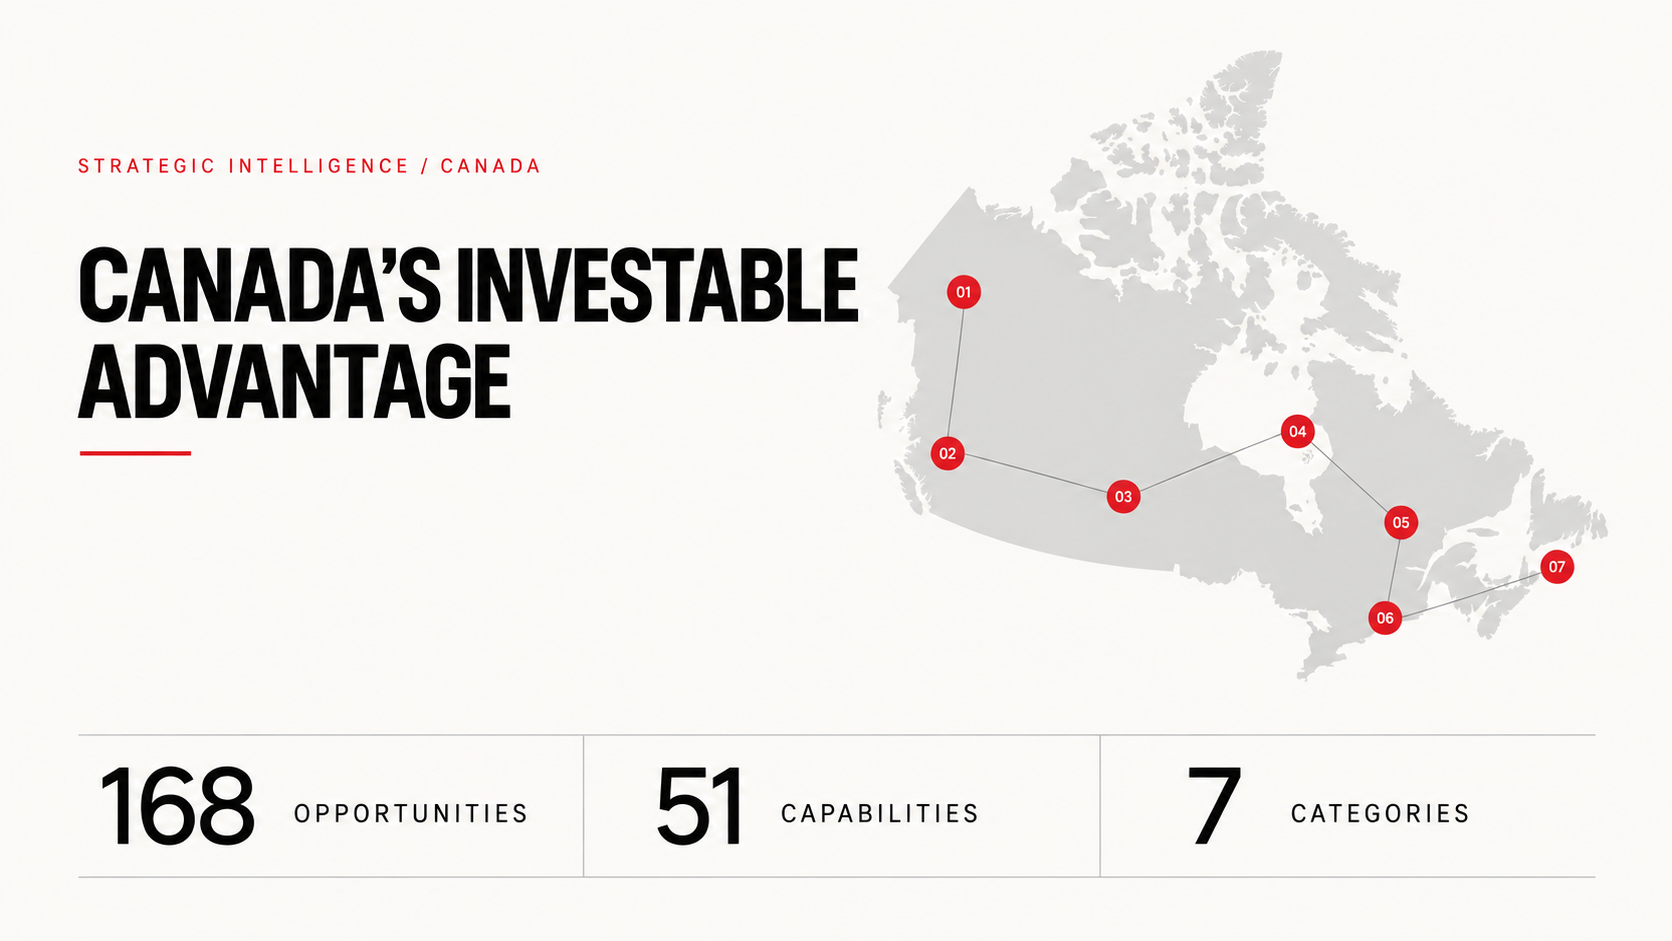
A new strategic intelligence tool turns Canada’s investment conversation into an opportunity map—organizing 168 modeled opportunities across 51 capabilities and seven strategic categories.
Dubai, United Arab Emirates —
Nader Sabry has launched the Canada Investable Advantage (CIVA), a strategic intelligence tool created to help investors, policymakers and businesses explore where Canada’s structural advantages meet real-world execution conditions.
The launch extends the thesis introduced in The Northern Giant’s $3 Trillion Move. That analysis asked whether Canada could translate its resource base, institutional capital, talent and geopolitical position into a long-horizon national investment engine. CIVA takes the next step: it makes the opportunity landscape navigable.
From investment momentum to investable clarity
The first Canada Investment Summit brought together investors from nearly 30 countries managing more than $100 trillion in assets. The Government of Canada reported nearly $500 billion in new investment commitments and a wider ambition to catalyse more than $1 trillion in total investment over five years.
The $3 trillion figure explored in Sabry’s earlier article is a long-range strategic scenario—not a current fund balance, announced commitment or pool of deployable capital. Its central question is the absorption gap: the distance between capital interest and the ability to move opportunities through the conditions required for delivery.
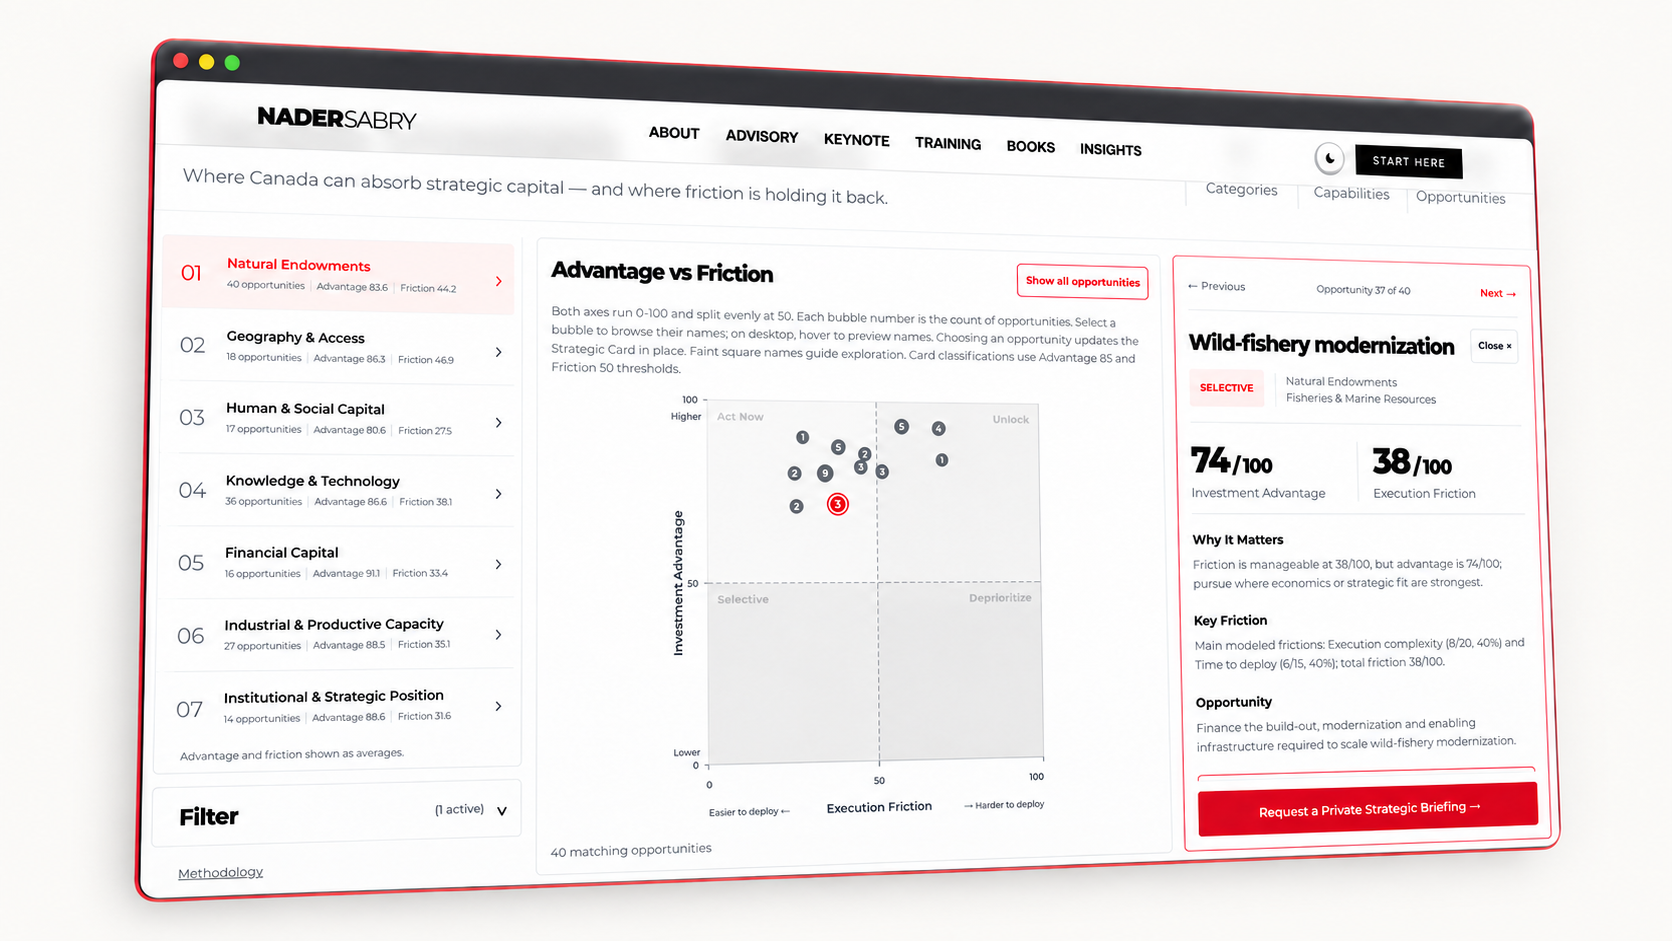
CIVA adds a practical lens to that question. The tool maps opportunities using two dimensions: Investment Advantage and Execution Friction. Users can compare categories, inspect clusters and open individual Strategic Cards to understand the factors shaping each modeled position.
Watch: how to use CIVA
A 30-second walkthrough: choose a category, compare opportunities, open a cluster and examine a Strategic Card.
How CIVA works
The experience is designed as a short path from national context to a specific, inspectable opportunity.
Explore categories
Start with one of seven strategic categories to see how Canada’s advantages are distributed across the economy.
Compare opportunities
Use the Advantage versus Friction matrix to locate clusters, compare modeled positions and narrow the field.
Examine Strategic Cards
Open an opportunity to review its classification, scores, key friction and the investable activity it represents.
How investors and governments can use CIVA
CIVA’s practical benefit is that it compresses a large, fragmented opportunity landscape into one shared frame. It helps users move from broad national narratives to specific opportunities, while keeping potential advantage and execution difficulty visible at the same time.
For investors
- Screen the landscape: explore 168 modeled opportunities across seven strategic categories before committing resources to deeper diligence.
- Compare opportunity quality: use Investment Advantage and Execution Friction together to distinguish an attractive strategic thesis from its delivery conditions.
- Build focused shortlists: move from categories to clusters and Strategic Cards to identify opportunities that fit a mandate, capability or risk appetite.
- Prepare better questions: use the framework to structure early discussions with governments, partners, operators and advisers.
For governments
- See Canada through an investor lens: understand how structural strengths and execution barriers appear together across the opportunity landscape.
- Locate recurring friction: identify where policy, infrastructure, coordination, skills or delivery constraints may be weakening otherwise strong opportunities.
- Prioritize enabling action: focus reform, investment attraction and ecosystem development around specific opportunity clusters rather than broad sector promotion alone.
- Create a shared language: give agencies, investment-promotion bodies and public-private partners a common starting point for opportunity discussions.
“Canada does not have an opportunity shortage. It has a translation challenge: turning national strengths into opportunities that can be compared, understood and acted on. CIVA is designed to make that translation more visible.”Nader Sabry
Seven categories, one shared frame
The 168 modeled opportunities are organized across seven strategic categories. The distribution shows the breadth of the framework while keeping every opportunity connected to a common comparison model.
This structure deliberately widens the conversation beyond resources alone. It brings together assets, capabilities, institutions and constraints that shape whether an opportunity can move from strategic interest toward investable activity.
The matrix is a navigation and comparison tool. It does not guarantee investment outcomes, rank securities or replace project-level diligence. Scores and classifications are modeled assessments; users should review the methodology and individual opportunity details before drawing conclusions.
What one opportunity looks like
A Strategic Card turns a point on the matrix into a compact decision frame. Wild-fishery modernization, shown below, illustrates how CIVA keeps strategic potential and delivery conditions visible together.
Worked opportunity example
Wild-fishery modernization
Why it matters
Friction is manageable at 38/100, while advantage is 74/100; pursue where economics or strategic fit are strongest.
Key friction
The model identifies execution complexity and time to deploy as the main friction drivers.
Opportunity
Finance the build-out, modernization and enabling infrastructure required to scale wild-fishery modernization.
Illustrative modeled assessment from CIVA. It is a starting point for investigation—not an investment recommendation or substitute for project-level diligence.
Explore the Canada Investable Advantage
The tool is now available online. Users can begin with the category view, compare investment advantage and execution friction, then open a cluster to browse its opportunities and Strategic Cards.
Move from the national thesis to the opportunity map.
Launch the CIVA opportunity matrixFor the full framework and definitions, see the Canada Investable Advantage overview. For the wider strategic architecture, read The Northern Giant’s $3 Trillion Move and From Pledges to Participation.
Sources & related reading
Canada Investable Advantage — framework overview
Canada Investable Advantage — methodology and modeled assessments
The Northern Giant’s $3 Trillion Move — strategic analysis
From Pledges to Participation — the national investment pipeline
Prime Minister of Canada — Canada Investment Summit release, September 15, 2026