
Every CFO managing an AI budget has seen the number. $3.70 returned for every dollar invested. It comes from IDC (International Data Corporation) and Microsoft. It’s real. It’s also the most misleading number in enterprise AI. Not because anyone fabricated it. But because it’s an average — and this particular average hides a distribution that should change how every business allocates its AI spend. Here’s what the average isn’t showing you.
The Math Nobody Published
PwC’s 2026 AI Performance Study tracked 1,217 executives across 25 sectors. Here’s what they found: the top 20% of companies capture 74% of all AI economic value and generate 7.2× more AI-driven value than the average competitor. That 7.2× multiplier, combined with the $3.70 IDC/Microsoft average, produces a calculation that no single study has published — derived here from two sourced figures most decision-makers have seen separately but never combined.
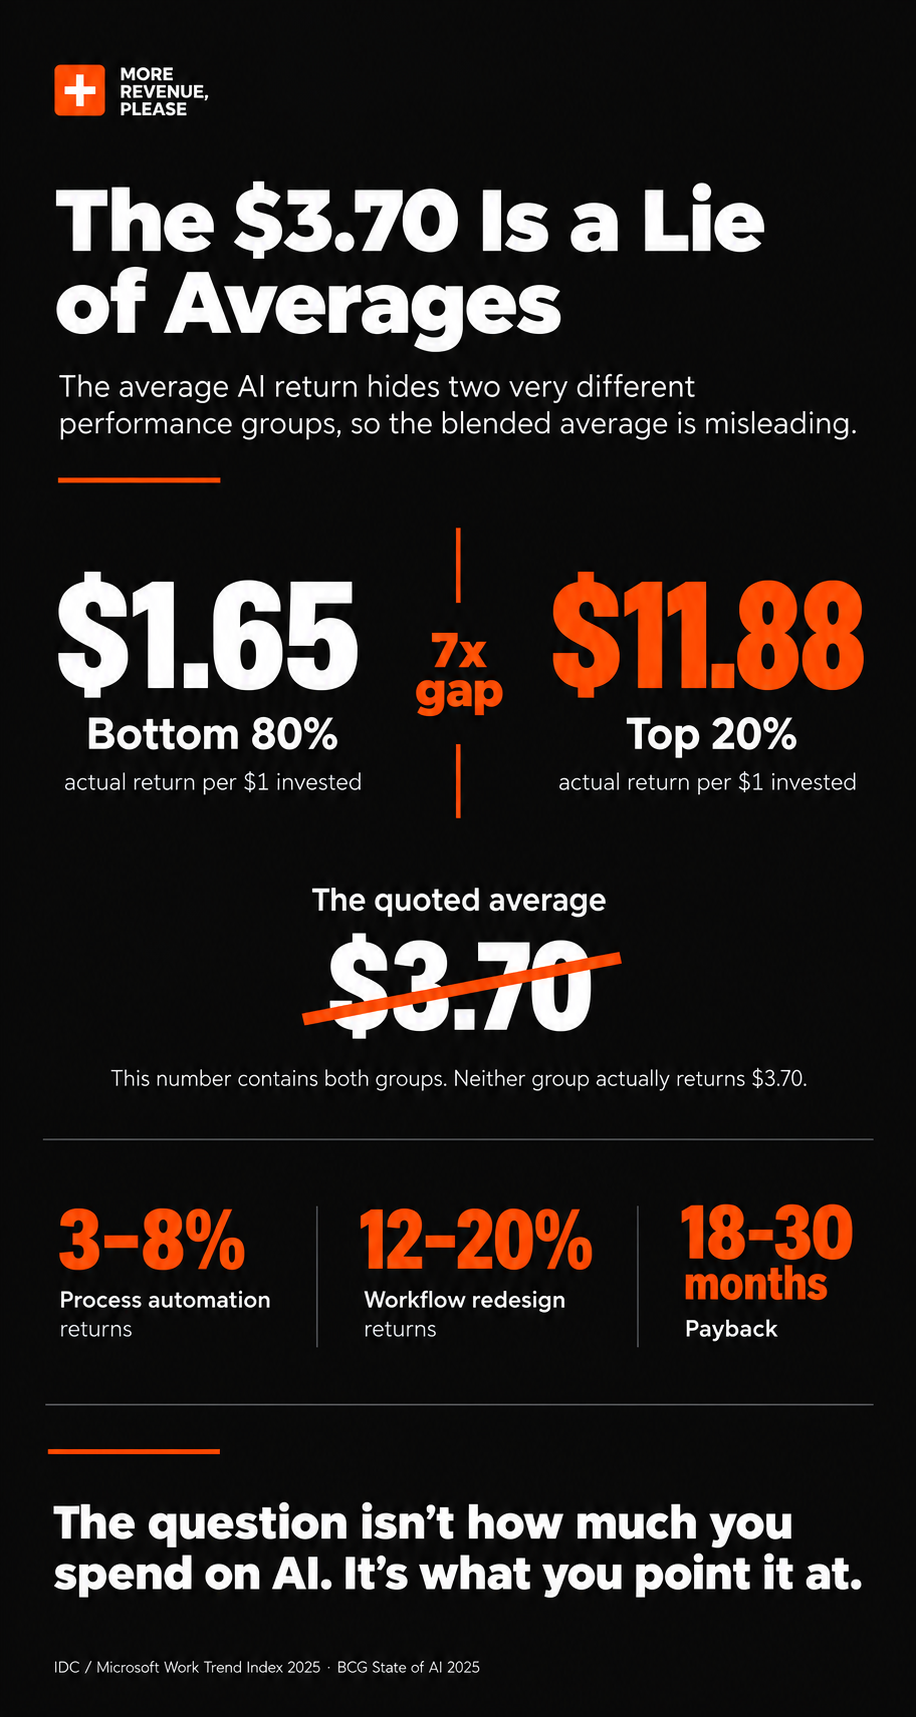
If the bottom 80% earns X per dollar and the top 20% earns 7.2X:
Weighted average: (0.8 × X) + (0.2 × 7.2X) = 2.24X = $3.70
X = $3.70 ÷ 2.24 = $1.65
7.2X = $11.88
The bottom 80% of companies are earning $1.65 per dollar invested in AI. The top 20% are earning $11.88. The $3.70 sits between them — accurate as a blended figure, useless as a benchmark for any individual company.
Think about what that means for a CFO who sees $2.00 in return and compares it to $3.70. They think the investment’s underperforming slightly. The same CFO who knows the real bottom-80% return is $1.65 has a completely different read. And the CFO who understands both numbers and asks why they’re not in the $11.88 group? That’s the right question.
$547 Billion. Unaccounted For.
The distribution gap isn’t the only number missing from board decks. The failure economics make it worse.
RAND Corporation analyzed 2,400+ enterprise AI initiatives. 80% failed to deliver their intended business value — twice the failure rate of regular IT projects. In 2025, enterprises put $684 billion into AI. By year-end, more than $547 billion had produced no measurable results. MIT found 95% of generative AI deployments produced no measurable P&L impact.
$547 billion. Not flagged in earnings calls. Not visible in most board reports — because 61% of enterprises never established a measurable baseline before deploying. You can’t report a failure you never set up to measure.
Gartner predicted 30% of gen AI pilots would be cancelled by end of 2025. Actual: at least 50% were abandoned. McKinsey’s 2026 State of AI study — 1,719 global executives — found only 6% of enterprises say AI has significantly moved their EBIT (earnings before interest and taxes). Unchanged from 2025.
This isn’t a technology problem. It’s a question-sequencing problem. The companies that started with efficiency built something any competitor can buy tomorrow at the same price. The money got spent. The position didn’t get built.
Where the Money Goes (and Doesn’t)
The budget tells the story before a single tool goes live.
A typical enterprise AI budget: 30–40% on software and SaaS (software-as-a-service) AI tools, 20–25% on cloud infrastructure, 41% on implementation and consulting (that’s the single largest line), 15–20% on internal AI talent, 8–12% on data platforms, 8–12% on governance and security. And at the very bottom: 3–8% on projects that could generate new revenue.
Three to eight percent. Everything else goes to infrastructure, tooling, governance, and deploying AI into existing workflows. All of which points at efficiency.
The BCG (Boston Consulting Group) 10/20/70 rule — 10% algorithms, 20% technology and data, 70% people and processes — is the most-cited enterprise AI framework. The 70% is where it matters. Aim it at training people to optimize existing processes and you get efficiency. Aim it at finding and closing new revenue and you get revenue. The allocation itself isn’t the problem. The question the allocation’s designed to answer is.
Total worldwide AI spending hit approximately $2.52 trillion in 2026 — up more than 40% year over year. AI now represents 18% of the average enterprise IT budget (up from 11% in 2024). Average enterprise AI budget: $186 million. Only 5–8% report measurable ROI at scale. The investment’s real. The return, for most, isn’t.
Why Efficiency Gains Don’t Last
The standard defense of efficiency-aimed AI: reduced costs improve margins and free up capital for growth. That’s true in the short term. But the 18–30 month economics look different.
AI process automation tools are available to every competitor at the same price. Any competitor can license the same tool and close your efficiency gap within one quarter. BCG’s research is direct about this: efficiency gains normalize into the industry margin baseline. They don’t build a position.
PwC’s August 2026 CEO Survey found something that should concern any CFO: 51% of companies that reported AI efficiency gains had seen those gains reverse within 8 months. Positive to negative. HBR’s July 2026 analysis confirms it — the efficiency advantage window closes as tools commoditize. And it closes fast.
BCG puts the infrastructure AI ROI timeline at 18–30 months to positive return. For a lot of efficiency programs, that’s two years of negative return before the investment compounds — at which point the tool’s often commoditized and the competitor’s caught up anyway.
PwC’s January 2026 CEO survey had the most damning single number: 56% of CEOs reported neither revenue growth nor cost reduction from AI in the previous 12 months. 32% got cost reduction only — efficiency, no revenue. Only 12% got both. The 32% are building a position that’s already eroding.
The Industries Actually Winning — and Why
The $1.65 vs $11.88 split isn’t uniform across sectors. Some industries are structurally better positioned to aim AI at revenue. Others are structurally stuck on efficiency.
Financial services leads by a wide margin. 65% are actively using AI (up from 45%), with 89% reporting both revenue gains and cost reductions — the highest double-win rate of any sector. Why? Because financial services can connect AI directly to a customer transaction. Faster underwriting means more policies written. Better risk scoring means better-priced products. The AI output gets priced. So the return compounds.
Retail and CPG perform well: 37% report costs reduced by more than 10%, and AI recommendation engines are delivering up to 49% more cross-sell revenue for the leaders. AI dynamic pricing generates +10% margin improvement and +13% sales during peak periods — because the output connects to a transaction.
Manufacturing shows a 12-month payback on predictive maintenance, and AI-mature logistics companies outperform peers by 23% on profitability. But it’s mostly efficiency. The AI output improves internal processes — and those are processes competitors can replicate.
Wherever AI can touch a customer transaction, revenue follows. Wherever it only improves internal processes, efficiency follows — and competes away.
Who’s Actually Earning the $11.88
The most striking economic fact of 2026 isn’t that most enterprise AI is underperforming. It’s that someone is performing extraordinarily well on that same investment. And it’s not the enterprise buyer.
Broadcom Q3 FY2026 (September 4, 2026): AI semiconductor revenue +221% year over year to $16.7 billion. HPE Q3 FY2026 (September 2): Cloud and AI +25.4% to $9.0 billion. Salesforce Agentforce ARR (annual recurring revenue): +240% to $1.5 billion. Microsoft AI: +123%. AWS: +37% — fastest pace in 18 quarters.
Goldman Sachs estimates AI-infrastructure beneficiaries account for roughly half of total S&P 500 earnings growth in 2026. Morgan Stanley found 21% of S&P 500 companies now cite at least one AI benefit — and those companies see cash-flow margin expansion at 2× the rate of non-AI peers.
The enterprise buyer spending $186 million on AI is funding Broadcom’s 221% revenue growth. The same dollars produce $1.65 per buyer-dollar and $11.88+ per vendor-dollar. The vendor sold AI as a product. The buyer deployed it as a cost tool. The return went where the question pointed.
AI-native SaaS companies now trade at 15–35× forward revenue. Traditional SaaS: around 6×. Markets aren’t pricing AI investment. They’re pricing AI revenue generation. There’s a difference.
The Measurement Problem That’s Already Costing You
Most enterprise AI budgets can’t be defended at board level — not because the AI didn’t work, but because the measurement framework was wrong from day one.
61% of enterprises can’t demonstrate measurable ROI from AI because they never established a baseline before deploying. The most commonly reported AI metrics in 2026: number of users, prompts, pilots completed. None of those connect to P&L. None.
The fully-loaded cost of an AI initiative is almost always underestimated. Platform licensing plus data preparation plus change management plus training plus ongoing governance consistently runs higher than the budget figure used to calculate ROI. When you apply fully-loaded costs, a lot of efficiency programs that look marginally positive turn negative.
CIO’s 2026 analysis named what’s coming next: the measurement crisis is technically over — enterprises now know how to count AI activity. The translation crisis is what follows. Converting AI activity into financial language a CFO can take to a board is still rare. Without that translation, AI budgets are the first cut in any cost review.
Why SMBs Are Outperforming Enterprises on AI ROI
This one surprises most enterprise executives: small and mid-sized businesses are outperforming them on AI ROI — by a lot.
Average AI ROI for SMBs: 3.7× over 18 months. Enterprises: 1.7× over the same period. SMBs outperform by more than 2×.
It’s not better technology. SMBs don’t have legacy systems to integrate. They’re hitting 90-day pilot-to-production timelines versus 12–18 months for enterprise. And they focus on narrow, specific use cases with a direct revenue connection. A $200–500/month AI tool that doesn’t generate visible revenue gets cancelled next month. The budget constraint forces the right question from day one.
A $186 million program that doesn’t generate revenue gets defended in a board deck. The scale creates room for measurement ambiguity. That’s the SMB’s real advantage over the enterprise — not resources, but the absence of room to avoid the question.
The Talent Cost of Efficiency-Aimed AI
AI talent is the scarcest and most expensive resource in the labor market right now. How you aim that talent matters economically.
IDC estimates the global AI skills gap may cost the economy up to $5.5 trillion by 2026 in product delays, missed revenue, and impaired competitiveness. AI talent demand exceeds supply 3.2 to 1 — 1.6 million open positions, 518,000 qualified candidates globally. AI roles command a 67% salary premium over traditional software engineering. Average time to fill a technical AI role: 66 days, 50% longer than non-technical positions.
If you’re pointing that scarce, expensive talent at efficiency, you’re using the hardest-to-hire resource in the labor market to build something a competitor can buy from a vendor next quarter. Point the same talent at revenue — pricing models, new products, customer lifetime value — and you’re building something that takes a competitor 12–18 months to replicate.
What the 20% Actually Do
PwC’s headline from the 2026 study deserves more attention than it gets: AI leaders focused on growth, not just productivity. Not as an aspiration. As a capital allocation decision made before the first dollar was spent.
They use AI for pricing, new products, sales conversion, and customer retention. The simplest first move: redirect the next AI use case from a cost workflow to a revenue workflow — pricing, upsell, retention, or new offer creation. Leaders put 15% of their AI budgets into agentic AI — AI that executes revenue actions: books appointments, closes renewals, reprices dynamically, captures upsell. Laggards have near-zero agentic investment.
Measured outcomes: dynamic pricing delivering +10% margin improvement and +13% sales during peak periods; customer retention AI producing +20% customer lifetime value and +31% higher retention; hybrid pricing models generating +38% higher net revenue retention versus pure subscription. BCG: AI leaders expect 2× the revenue growth and 40% greater cost reduction. They get both — because the model scales in both directions when it’s aimed at revenue first.
The First Question
Both groups — the 20% earning $11.88 and the 80% earning $1.65 — spent comparable money on comparable technology. The gap isn’t a technology gap. It’s a question gap.
The 20% asked: what can we sell, price, retain, or grow with this?
The 80% asked: what can we cut?
An efficiency gain competitors can reproduce in one quarter doesn’t compound. A revenue position that requires a competitor to rebuild their pricing model, their product, or their customer relationship — that does. The economic value of the difference is $10.23 per dollar invested.
The $3.70 average return isn’t wrong. It’s the wrong benchmark. The relevant question for any CFO reviewing an AI budget isn’t ‘are we above average?’ It’s ‘are we in the $11.88 group or the $1.65 group — and what question do we need to ask to move?’
Revenue from AI isn’t a technology advantage. It’s a decision advantage. Made before the deployment, at the question stage.
About More Revenue Please
More Revenue Please covers the specific levers: repricing, retention, upsell, new offer creation, and revenue recovery from what the business has already earned but not yet collected.
Sources
- PwC 2026 AI Performance Study — PwC — April 13, 2026
- The State of AI in 2026 — McKinsey — August 25, 2026
- IDC / Microsoft Work Trend Index — IDC / Microsoft — 2026
- RAND Corporation Analysis of 2,400+ Enterprise AI Initiatives — RAND Corporation — 2026
- AI Leaders Outpace Laggards on Revenue Growth and Cost Savings — BCG — September 30, 2025
- Broadcom Q3 FY2026 Earnings — Broadcom / Yahoo Finance — September 4, 2026
- State of AI in the Enterprise 2026 — Deloitte — 2026
- Gartner Worldwide AI Spending Forecast — Gartner — 2026
- The $5.5 Trillion Skills Gap — IDC / Workera — 2026
- CFO’s Guide to Measuring ROI on Finance AI — Kognitos — 2026
- Goldman Sachs S&P 500 AI Earnings Analysis — Goldman Sachs — 2026
- PwC CEO Survey Snapshot — PwC — August 2026
- HPE Fiscal Q3 2026 Earnings — HPE — September 2, 2026
- AI and the Looming Competition for Margin — Harvard Business Review — July 2026
- Morgan Stanley AI Market Trends 2026 — Morgan Stanley — 2026
- SMB vs Enterprise AI ROI 2026 — BigSur AI / Doolly — 2026