
Consumer transactions are down. Revenue is up. That contradiction is where most businesses are getting lost.
The cause is not a demand collapse — it is a value shift. Customers are buying less often but spending significantly more each time they commit.
If your model still runs on frequency, you are optimising for the wrong number.
The Numbers Behind the Shift
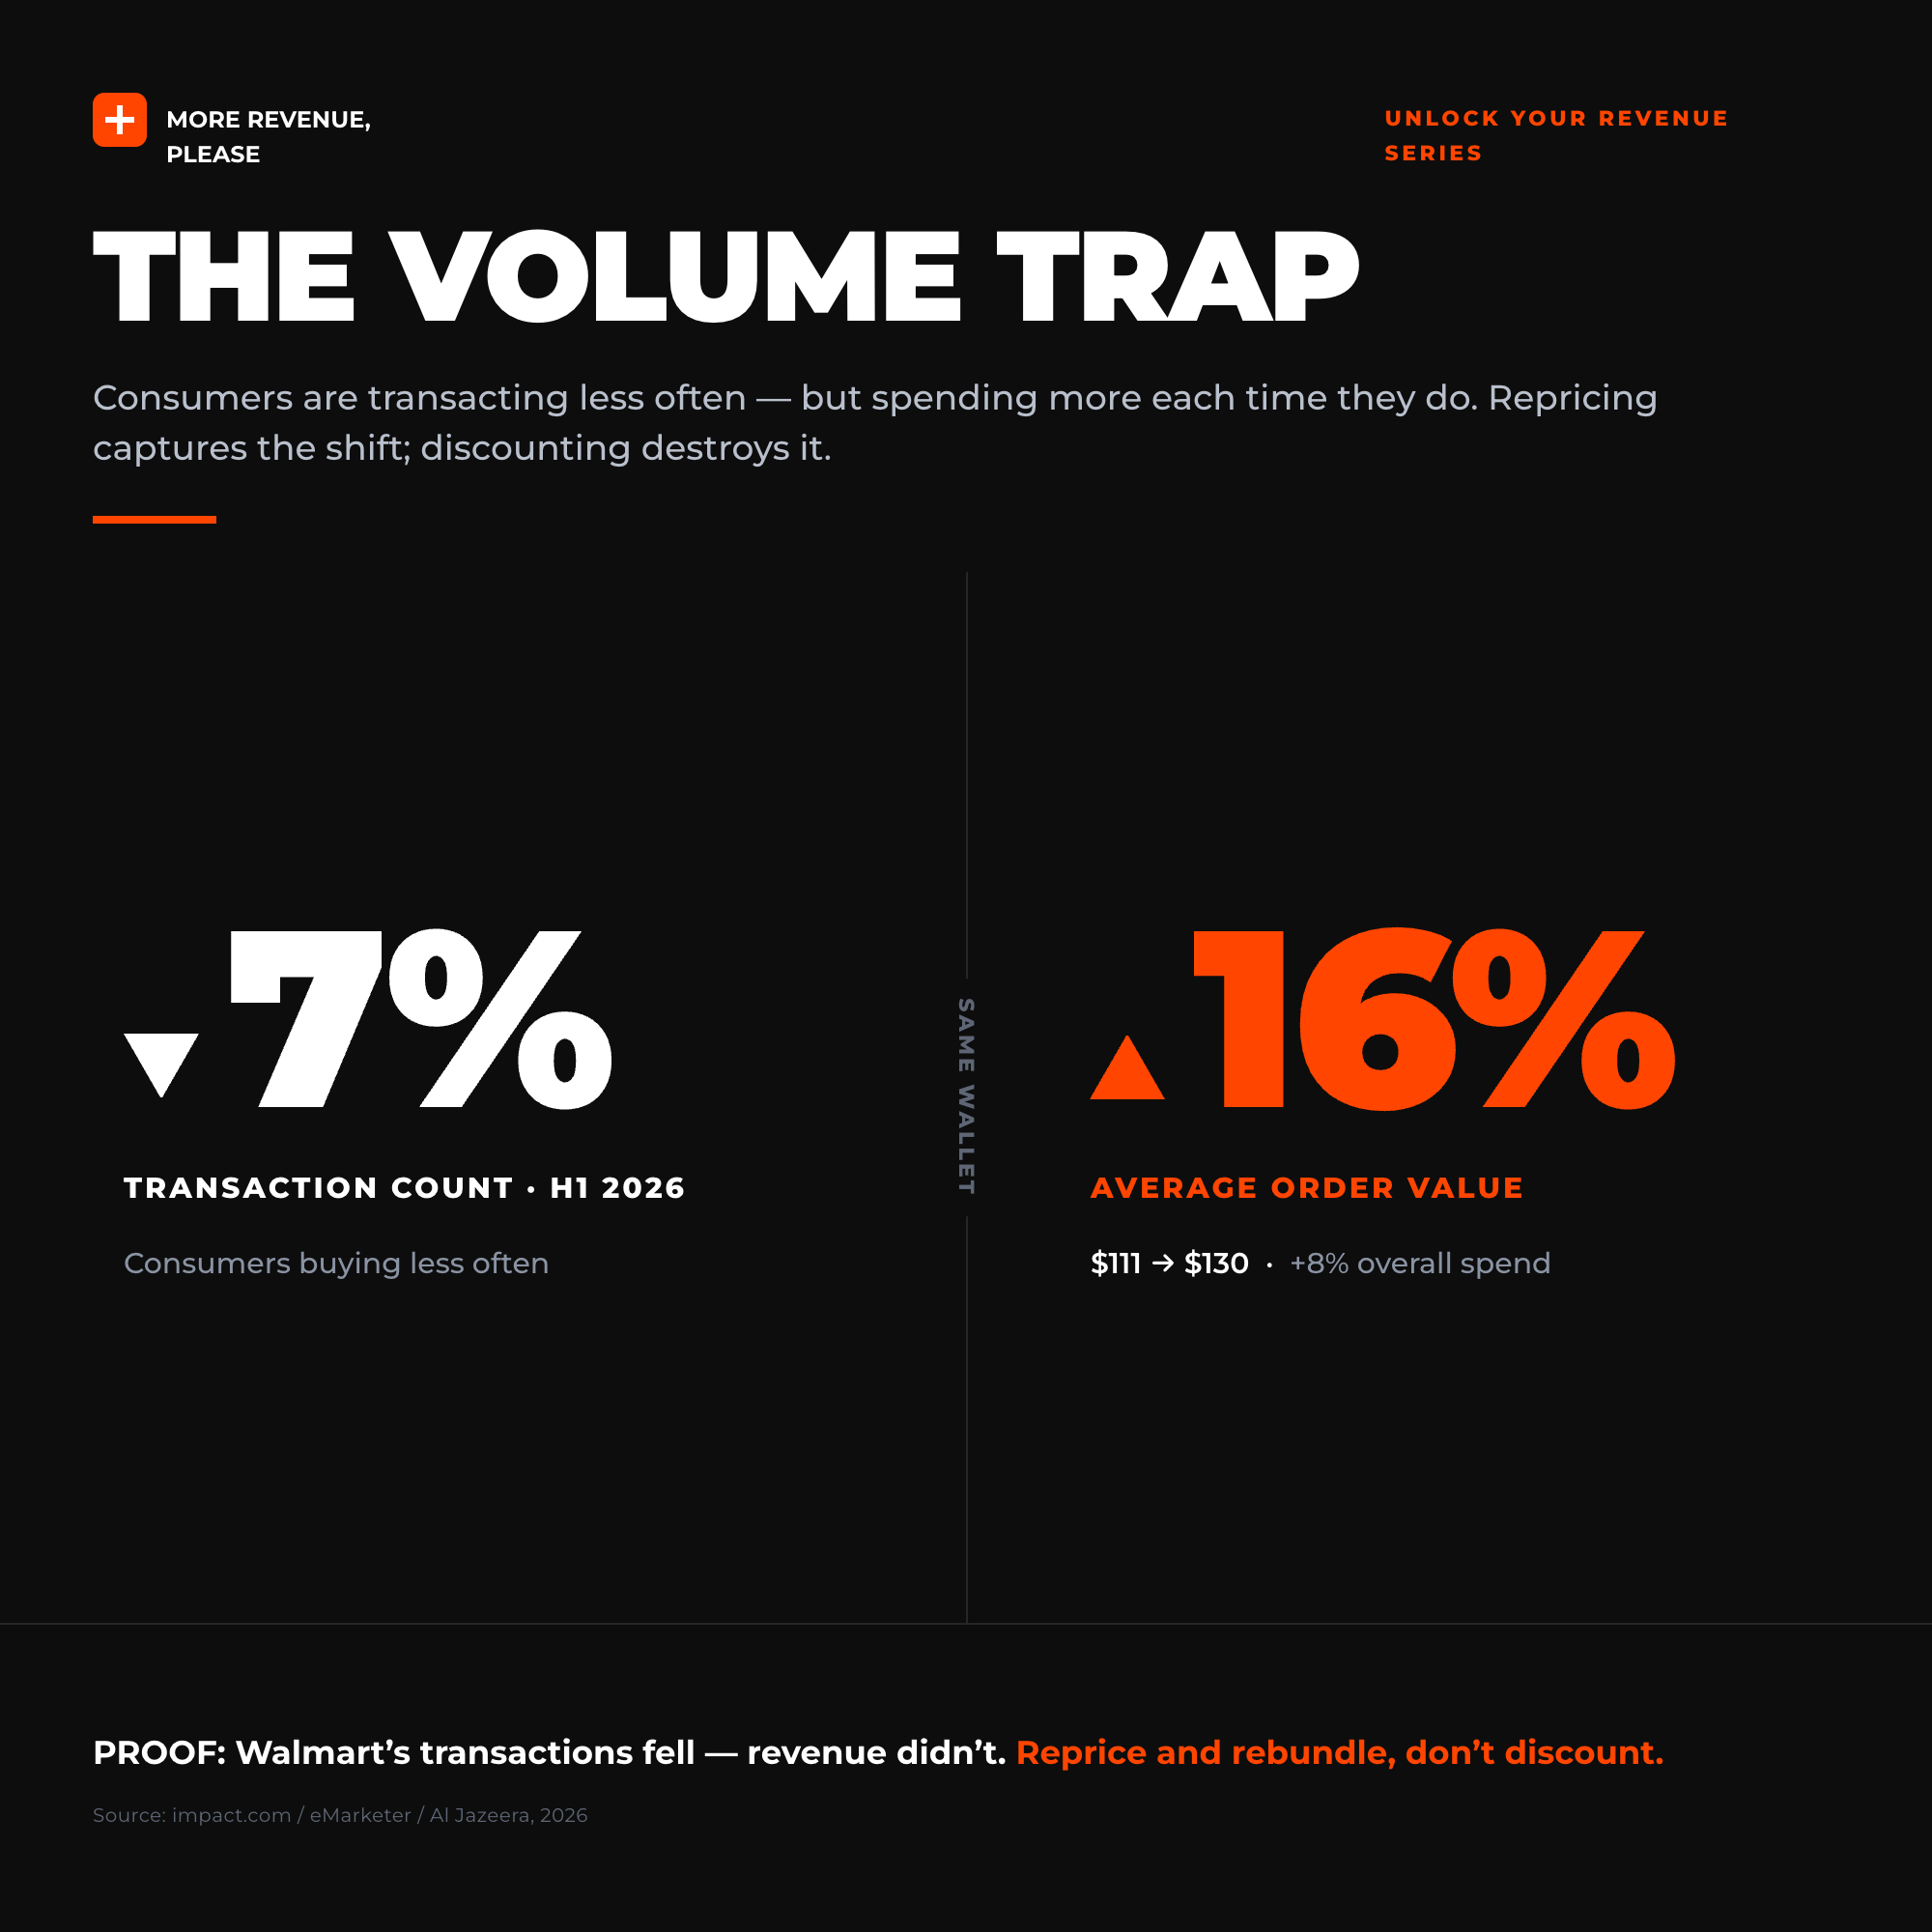
Consumer transaction counts fell 7 percent in the first half of 2026, according to impact.com's H1 2026 Commerce Data Report. Taken alone, that number triggers every alarm on the commercial dashboard.
Look at what happened alongside it. Average order value (AOV) rose 16 percent — from $111 to $130 — in the same period (impact.com, H1 2026). Overall consumer spending is up 8 percent year-on-year (eMarketer, reported by AdWeek, 2026). The money is still moving. The pattern of how it moves has changed.
Walmart confirmed this on 20 August 2026. The retailer reported a drop in transaction count across its retail network while total revenue held. Fewer visits. Same spend. Customers making deliberate, higher-value choices and skipping the marginal trips entirely.
This is not a demand problem. It is a business-model alignment problem. The businesses reading it as a crisis are the ones chasing the metric that no longer drives the revenue.
Why Businesses Are Getting This Wrong
Most commercial models were designed for frequency. Loyalty programmes reward repeat visits. Promotional calendars are built around flash sales and short-window discount offers. CRM sequences re-engage customers after a fixed number of inactive days. Every part of the system was calibrated to drive transaction count upward.
When transaction counts drop, the reflex is to pull those levers harder. Deeper discounts. More aggressive re-engagement cadences. Shorter intervals between offers. The system was built to solve for frequency, so that is what it does.
The structural problem is that discounting to recover volume destroys the AOV gain. A buyer now primed to spend $130 per transaction gets retrained back to $80 by a 20-percent-off campaign. You recover the frequency metric and lose the revenue.
The volume trap works like this: the metric drops, the team responds with familiar tools, and those tools erode the very thing that was performing. Transaction count looks better on the dashboard. Gross margin does not. CFOs who focus only on top-line activity miss the damage until the P&L arrives.
The businesses that escape the trap are the ones that recognise discounting as a frequency tool, not a revenue tool. Frequency tools have no place in a value-shift environment. The correct response is to capture the higher value that buyers are now prepared to pay when they commit.
What Changed in the Consumer
Consumers did not stop spending. They changed when and how they commit.
Three years of sustained inflation produced a durable and specific buying behaviour: research longer, decide less often, spend more when the decision is made. Customers are running informal cost-per-use calculations before committing. A $150 purchase that delivers value over three years gets approved. A $40 impulse purchase that creates clutter does not.
This means the pre-purchase consideration phase has lengthened materially. Customers arrive at a buying decision with higher intent and lower price sensitivity. They have already ruled out cheaper alternatives. They are not looking for the lowest price — they are looking for the right solution. When they find it, price resistance drops and conversion rates rise.
The typical higher-consideration buyer in 2026 has reviewed two to four alternatives before reaching you. They have a clear idea of what they want and have already justified the spend internally. What they need from you is confidence that your offer is the right one — not a reason to spend less.
For businesses, this is the best possible customer to convert. The pre-sell is done. The buyer has decided they want what you offer. The question is whether your pricing and packaging are set up to capture what they are prepared to pay — or whether your commercial model signals that you are still competing on frequency.
Who Is Winning Right Now
The businesses outperforming in this environment share one characteristic: they did not panic about transaction count. They read the shift and restructured around it.
Businesses that repriced upward and held are seeing AOV gains that outrun the volume softness. Where demand was clearly present and price sensitivity was low, they tested increases of 10 to 20 percent, held what stuck, and stopped running discounts mid-funnel. Fewer transactions. Materially higher margins per transaction.
Businesses that moved into premium bundling are capturing value already sitting inside existing relationships. A customer buying three items separately becomes a customer buying a complete solution package at 25 percent above the sum of the parts. Purchase count is lower. Revenue per customer is higher.
Businesses that reactivated dormant customers with upgrade offers rather than discounts are generating higher reactivation revenue. The discount approach brought customers back briefly and cheaply. The upgrade approach brings them back at higher AOV with better retention.
The thread running through all of this is the same: the revenue was already inside the existing customer relationships. Reviewing the portfolio of existing products and services to find where AOV can rise is where this work starts. Our piece on portfolio revenue recovery covers the framework for running that review in a structured way.
What to Measure Instead
The volume trap is partly a measurement problem. Transaction count is visible on every dashboard. Average order value, revenue per customer, and gross margin per transaction are rarely front of screen — but they are the numbers that tell you whether the value shift is working for or against you.
Track AOV weekly, segmented by product line and customer cohort. Watch revenue per active customer rather than active customer count. Monitor gross margin per transaction rather than units per period. These three metrics will tell you where to reprice, where to rebundle, and where to stop discounting before the quarterly P&L makes it obvious.
The businesses that catch the shift early act on it in the commercial model. The ones that catch it late read it in the margin report. That gap — between early action and late discovery — is where the competitive advantage sits. The businesses that move first on repricing and rebundling lock in the margin gain before competitors even recognise the shift.
Five Moves to Capture the Value Shift
These are not strategic pivots. They are operational adjustments executable in the next 30 days. Each one works independently — you do not need all five to move the number.
1. Audit your AOV by product, service, and customer segment. Identify which lines are rising and which are flat. Rising lines are where buyers are already telling you they want more — and where you can test higher price points with the least volume risk. Declining lines may need repricing upward or retirement, not promotion.
2. Test a price increase on your top three offers. Run 30 days at 10–15 percent above current pricing on your highest-demand lines. Track AOV and gross margin — not units sold. A small volume drop with a larger AOV gain is the right trade in this environment.
3. Build a premium bundle for high-consideration buyers. Group two or three complementary products into a package priced 20–30 percent above the sum of the individual items. Frame it around the outcome it delivers, not the components. If the bundle includes a recurring element, the value compounds further — the mechanics of that are in our piece on the subscription revenue layer.
4. Reactivate dormant customers with your best offer — not a discount. Reach them with a tiered upgrade, a premium package, or priority-access offer. Position around value, not concession.
5. Remove the noise. Identify the lowest-AOV, highest-volume SKUs or service tiers in your offer stack and reprice or retire them. A crowded offer stack pulls attention away from the lines that are working and pulls average transaction value down with it. Fewer, better offers aligns with how buyers are now deciding.
The Bottom Line
The market is not buying less. It is buying smarter. Customers are concentrating their spending on fewer, higher-value purchases — and they are prepared to pay for the right solution when they find it.
That is not a problem to solve. It is a shift to align with.
The businesses that restructure for value — repricing, rebundling, reactivating at a higher tier — will capture the revenue that frequency-obsessed competitors leave on the table.
The volume trap only closes on the businesses still optimising for the number that no longer drives results. Stop counting transactions. Start counting what each one is worth.
The opportunity is already in your existing customers. The question is whether your pricing and packaging are positioned to capture it.
Get the book
More Revenue Please by Nader Sabry — 100 ways to find more revenue inside your business, starting today. → Get the book on Amazon